For numerous years, scientists have explained the origin of our universe by merging the hot Big Bang with a singularity. They argue that the Big Bang marked the birth of space and time. However, in the early 1980s, a new concept arose known as cosmic inflation. This theory proposed that before the hot Big Bang, the universe already existed and operated in a completely different manner. In 2018, we now possess compelling evidence that contradicts our previous belief that the Big Bang was the starting point of everything.
The Origin of the Universe and the Singularity
Our understanding of the origins of the universe traces back nearly a century to the concept known as the Big Bang. In 1924, Edward Hubble made a groundbreaking observation by measuring the distance to nearby spiral nebulae. To his surprise, he discovered that these nebulae were actually galaxies and that they were moving away from us and from one another. Prior to this discovery, it was widely believed that the universe was contracting, based on Einstein’s theories and the influence of gravitational forces.
In 1931, Georges Lemaître put forward the idea that by extrapolating the observed expansion of the universe backwards in time, one could infer that the universe was smaller in the past. This implies that at some point in the distant past, all the mass of the universe would have been concentrated at a single point, which Lemaître referred to as the “primordial atom.” It is believed that this is the point where the fundamental structure of time and space as we know it originated.
Previously, it was simply a philosophical concept. If the cosmos is currently expanding and cooling, then it must have been smaller, denser, and hotter in the past. However, in 1968 and 1970, a team of scientists, led by Stephen Hawking, released papers demonstrating that a mathematical singularity was an unavoidable starting point for relativistic models of the Big Bang. In other words, in order for the equations to be valid, it is necessary to assume that all the matter and energy in the Universe were once concentrated in a single point.
Consequently, for numerous decades, the two perspectives of the Big Bang – as a state of high temperature and density characterizing the early universe and the point of origin of the singularity – were inseparable. It represented a singular concept.
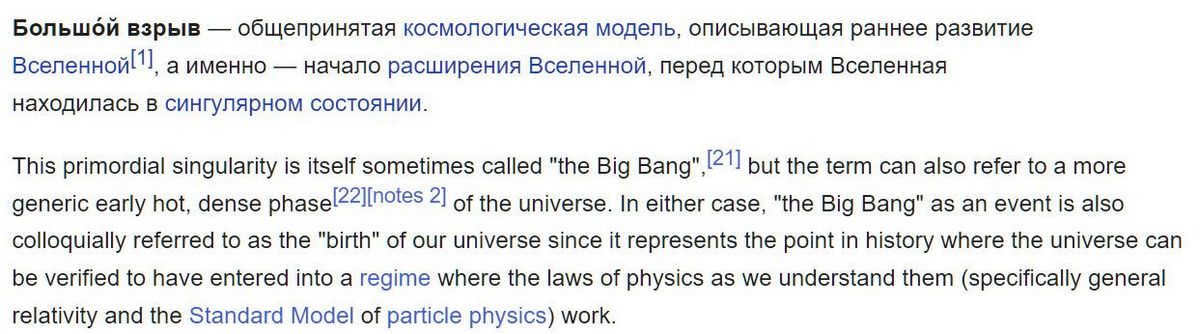
However, gradually scientists are beginning to recognize that the universe existed for a certain period prior to the well-known “hot” Big Bang. It was preceded by another state known as inflation. In other words, what came before the Big Bang was also undergoing expansion and may have even possessed its own proto-energy.
All of these events occurred over 13.8 billion years in the past, and one might assume that such intricacies would be forever beyond our grasp. However, in reality, with the current level of technology, they can be verified. The distinctions between a universe that commenced with a hot Big Bang and one that initially experienced an inflationary phase preceding and giving rise to the Big Bang are exceedingly subtle, yet they do indeed exist.
So, what sets apart these two models? Essentially, in a "hot" Big Bang scenario, the Universe would have reached the utmost temperatures and energies conceivable, all the way down to the singularity. This particular stage in the existence of our Universe is referred to as the "Planck epoch," which would have endured for a mere 10-43 seconds. During this phase, the size of the Universe would have been smaller than 10-35 m ("Planck radius"), with a temperature of approximately 1032 K ("Planck temperature"), and a density of about 1093 g/cm³ ("Planck density"). It is important to note that nothing could surpass this density or heat level – it would signify a completely different Universe governed by distinct laws of physics.
If we were able to demonstrate that the temperatures or densities were significantly lower (or disproportionately higher), this theory would be invalidated. The theory is fundamentally rooted in mathematics, but empirical evidence always takes precedence.
Regrettably, we lack the means to directly observe these parameters in our current era. We can only calculate them. Thus, we have no direct evidence (or contradiction) for the theory of the “Big Bang = Singularity” at this point.
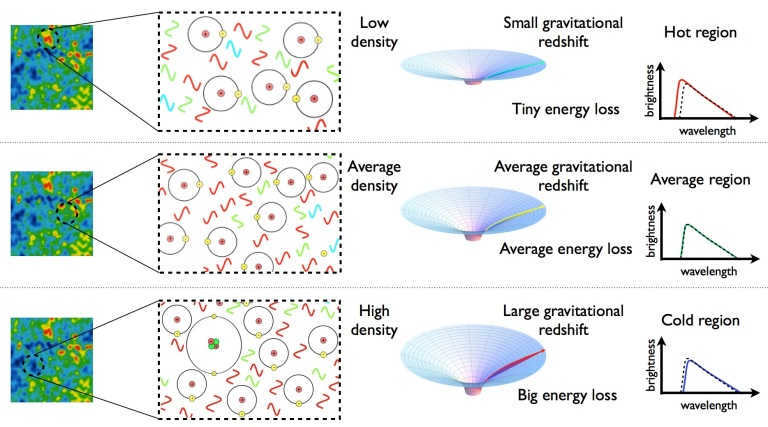
However, there exists an alternate approach. In the event that the universe previously possessed this “typical” density and temperature, it possessed flaws as we comprehend it: areas that were both extremely dense and sparsely populated. As the universe underwent expansion and cooling, the highly dense regions exerted a gravitational force, progressively drawing in more matter and energy over time, thereby growing in size. Conversely, the sparsely populated regions released their matter and energy to the denser formations in their vicinity. This process played a pivotal role in the formation of the foundational structures that would eventually give rise to the cosmic web.
The presence of these imperfections is the sole reason for the formation of stars and galaxies, and it is solely due to them that we exist at this very moment. Numerous confirmations of their existence can be found, yet they require no proof: in a Universe that is entirely “uniform,” such a vast array of immense and varied structures would not have come into being, and our existence would be nonexistent.
The information contained within the current cosmic web was established in the past. The foundations for the expansive structures we observe today were set in place during the early stages of the Universe. The stars, nebulae, and galaxy clusters we see now can be linked back to the initial irregularities in density that emerged when the first atoms formed. This correlation is a result of the influence of gravity and the relationship between matter and energy, as explained by the General Theory of Relativity, which states that the concentration of matter and energy influences the curvature of space.
Even today, we can still observe the remnants of these ancient seeds, albeit in a faded state, as small variations in temperature within the surrounding space. Some areas of space appear slightly “warmer” due to the presence of more matter, while others appear slightly colder. This phenomenon is known as the cosmic microwave background, which is essentially the lingering radiation from the momentous Big Bang event that was first detected in 1965. The temperature of this residual glow hovers around an astonishingly low 2.72548 ± 0.00057 Kelvin, almost reaching absolute zero. Nevertheless, it undeniably exists.
Background radiation
We are all surrounded by this background. It is incredibly faint (after all, 13.8 billion years have passed!) to the point where only our most advanced tools can pick it up. Interestingly, when scientists first stumbled upon it, they were initially perplexed, assuming their equipment was malfunctioning. However, the truth is that deep space is not absolute zero, contrary to what we were taught in school. This is because the remnants of the Big Bang have left behind a radiation that keeps the temperature of space at nearly three Kelvin. Although this temperature is gradually decreasing, it is projected that in a few billion years, future civilizations will require even more powerful instruments to detect it. And beyond that, the secrets of the universe’s origins will remain completely veiled.
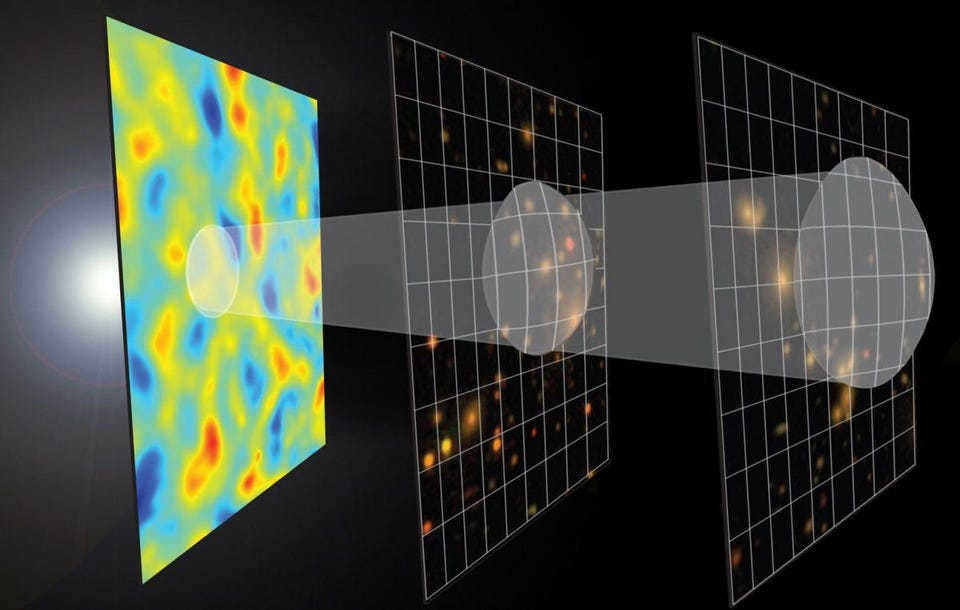
However, at present, our devices have the ability to observe this ancient background, provided they are finely tuned. This is because the light originating from the farthest corners of space must travel to the “eyes” of the observer. As a result, the following phenomena occur:
- Superdense regions, which contain more matter and energy than the average, will appear cooler. This is because light must “escape” from the larger gravitational potential;
- On the other hand, regions with lower density, containing less matter and energy, will appear hotter than average. This is because light has an easier time reaching us in these areas;
- Regions with average density and gravitational potential will exhibit cosmic microwave background temperatures that are considered average.
Regrettably, the initial phases of our Universe are beyond our ability to observe: there was essentially nothing present to be observed. However, even the imprint of the Universe 380,000 years after its inception provides a substantial dataset for analysis.
What is the origin of these variations? Why is the universe not uniform in all directions? The answer to these questions depends on the version of “the beginning of everything” that you subscribe to:
- According to the theory of the Big Bang, the universe was created with an initial set of imperfections. These imperfections then grew and changed due to the laws of gravity and particle interactions, including interactions between normal and dark matter.
- If we accept the inflationary theory of the universe’s origin, where the Big Bang happened after a period of cosmic expansion, then these imperfections are caused by quantum fluctuations. These fluctuations occur even in empty space because of the uncertainty of energy and time in quantum mechanics. This means that our universe wasn’t randomly created with irregularities – if space and time existed before the Big Bang, it couldn’t exist in any other form.
The second version of the explanation provides a significant clue. If this hypothesis is accurate, then it implies that the pre-existing quantum fluctuations are somehow manifested in the Big Bang. Throughout billions of years, these minor manifestations have been magnified to immense proportions due to the universe’s expansion. Subsequent fluctuations have extended upon them.
Consequently, we reach an important deduction. If something existed prior to the explosion, it must be the largest, the most “stretched.” Theoretically, even larger than the expanse of our Universe itself – which is expanding as a consequence of that very explosion. The outcomes should be observable on a scale surpassing the cosmic horizon: the so-called superhorizon fluctuations. If they do exist – then the Big Bang itself cannot be considered the origin of everything.
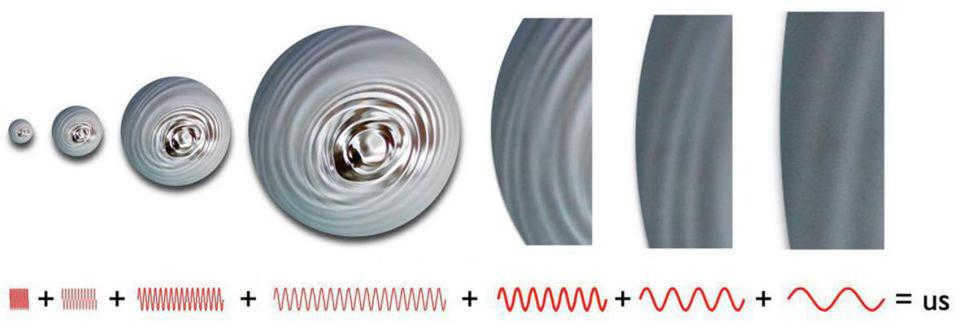
It would be extremely difficult to detect this phenomenon. Any fluctuations that may have occurred just prior to the explosion have already been stretched to a size larger than the currently observable Universe. Furthermore, these later fluctuations are layered on top of the earlier ones, making it even more challenging to discern any meaningful signal. However, we can at least grasp the underlying methodology: if something existed prior to the Big Bang, we can begin searching for immense fluctuations that should not have been present if the universe originated from a singularity.
One way to test the existence of superhorizon fluctuations is by examining the universe and determining whether these fluctuations are present or not. The distance a signal can travel at the speed of light is limited, so it’s important to understand when these fluctuations were emitted.
- The physics that has developed since the hot Big Bang started determines the scales smaller than the universe’s horizon.
- The upper limit of what could have been affected by physical signals since the hot Big Bang began is represented by scales that are equal to the horizon.
- Scales that are larger than the horizon, which are known as superhorizon scales, are beyond the limits of what could have been caused by physical signals generated during or after the Big Bang.
It is challenging enough to spot these broad “smears” at our current level of technology from inside our Universe. However, fortunately, we have another way of obtaining information by observing the polarization of the light from the cosmic microwave background.
Polarization of light
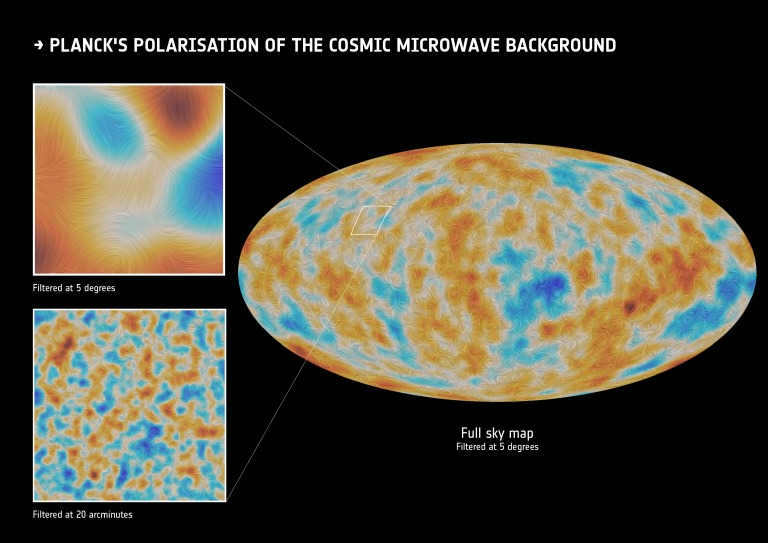
The following explanation may be quite technical, but in essence it can be summarized as follows: instead of focusing on the temperature of the relic radiation, we examine its polarization. This refers to the structure of the electromagnetic waves that have reached us from that time period. By analyzing the polarization, we can gain insights into the structures that existed in the regions through which those waves traveled.
As light travels through the vast expanse of the Universe, it inevitably interacts with the matter it encounters, particularly electrons. When light is polarized in a radially symmetric manner, it demonstrates the polarization of the E (electric) vector. On the other hand, if light is polarized in a clockwise or counterclockwise direction, it exemplifies the polarization of the B (magnetic) vector.
Furthermore, we can conduct a correlation analysis by examining the polarization of the light we capture and the temperature fluctuations of the cosmic microwave background on equivalent angular scales. This approach enables us to eliminate extraneous interference and identify any residual influences from the most significant fluctuations. Consequently, we can determine which scenario is unfolding before us: the “singular Big Bang without inflation” or the “inflationary state that precipitated the hot Big Bang.”
How can we differentiate between these two scenarios for the origin of the universe based on the polarization? Here’s the super-technical explanation:
- In both cases, we anticipate observing sub-horizon correlations (both positive and negative) between the polarization of the E vector in the cosmic microwave background and the temperature fluctuations within it. This is quite evident: if there is matter containing electrons in the path of light, there will be polarization and temperature variations distinct from the rest of the background.
- For both scenarios, we anticipate that these correlations will be null on the cosmic horizon scale, which presently corresponds to an angular scale of roughly 1 degree and a multipole momentum ranging from l = 200-220.
- The initial plot, which was released by the WMAP telescope team in 2003 (precisely 20 years ago!), displays the “TE mutual correlation spectrum.” This spectrum portrays the correlations between E-mode polarization and temperature fluctuations in the cosmic microwave background.
- Upon closer inspection, it becomes evident that at subhorizon scales (located to the right of the green line), both positive and negative correlations are present. However, at superhorizon scales (located to the left of the line), a substantial “failure” is clearly observed – a significant zone of negative correlation. This observation aligns with the predictions made by the inflation theory (solid line), but is fundamentally inconsistent with the Big Bang singularity theory (dashed line).
Undoubtedly, that occurred two decades ago, and our technology has made significant progress since then. The Planck satellite has taken the place of the WMAP satellite, boasting superiority in nearly every aspect. It observed the Universe across a wider range of wavelengths, delved into smaller angular scales, provided a more accurate measurement of temperature variations, featured a specialized polarimetric instrument, and captured more frequent snapshots of the celestial sphere, further minimizing the probability of inaccuracies.
Moreover, the final (2018) TE cross-correlation data from the esteemed Planck team present awe-inspiring outcomes. The clarity of the findings is unparalleled:
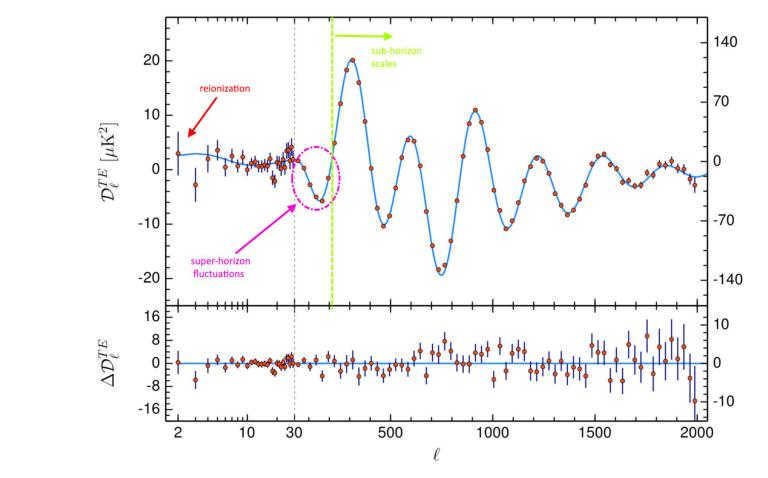
From the satellite data, it is evident that there is no doubt that the Universe accurately exhibits fluctuations beyond the reach of its horizon. This implies that the widely accepted non-inflationary singular Big Bang model, which has been considered valid for nearly a century, is not in line with our observations of the Universe. Instead, we observe that the hot Big Bang must have been preceded by a period of inflation, although it was relatively short-lived based on the magnitude of the fluctuations and their impact on the present-day cosmos.
It is likely that our Universe existed prior to the Big Bang, possibly for a brief fraction of a second. At that time, atoms may not have formed yet, but quantum processes were already occurring, leading to uneven distribution of energy. Subsequently, the Big Bang occurred.
What was the appearance of it all, what form did it take, and for how long? It remains uncertain. Nevertheless, it was undeniably our Universe: the principles of quantum physics that we are familiar with were operational within it, and their outcomes can be observed in the celestial heavens, if one scrutinizes closely.
Furthermore, there is space for new revelations and fresh hypotheses. This is because we are now aware that the Big Bang, as it turns out, was not the inception of everything.
The Configuration of the Universe
The configuration of the Universe is a fundamental inquiry in cosmology. Specifically, the geometry of the universe determines the ultimate destiny that awaits us.
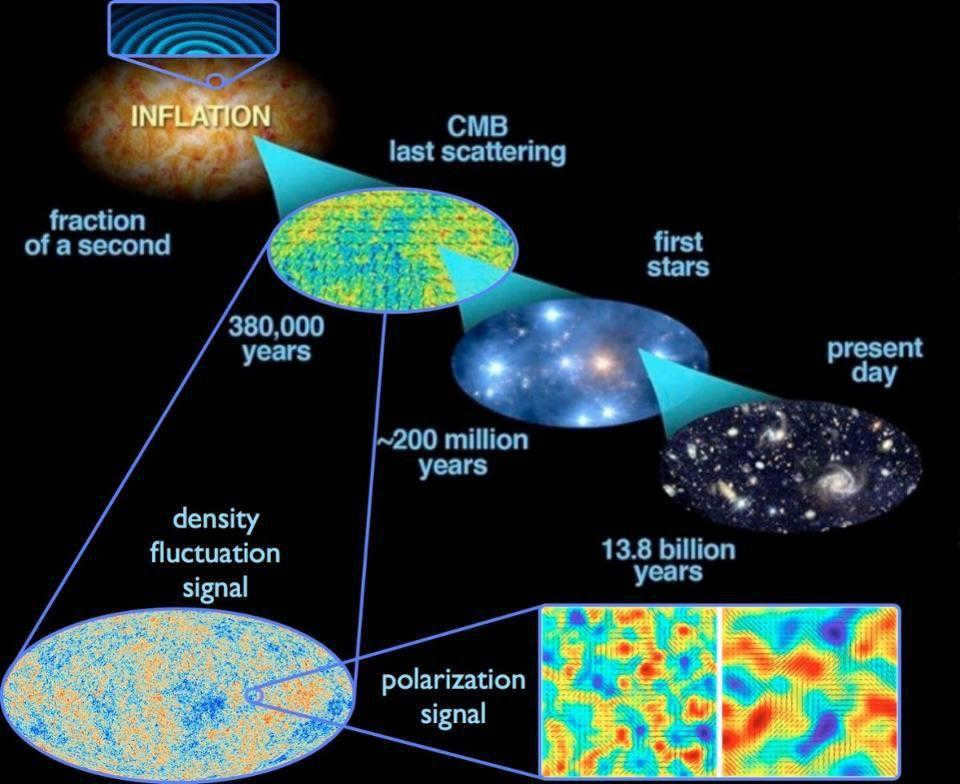
For many years, it has been widely accepted that the Universe is flat and remarkably uniform. The notion of the universe being uniform is a direct consequence of the inflationary theory proposed in the late 1970s and early 1980s. This idea was further supported by the initial maps of the cosmic microwave background radiation discovered by Arno Penzias and Robert Wilson in 1965. However, the depiction of the cosmic microwave background has continuously evolved and become more intricate:
The fluctuations in temperature of the cosmic microwave background are approximately 2.7255±0.0006K, and they follow a specific pattern rather than being random. This pattern, known as the RI, can appear warmer or colder depending on the distance between two points. In a flat Universe, this distance would be smaller compared to a curved Universe. Measurements taken by the Planck satellite indicate that the Universe is not completely flat. The observable part of the Universe has a diameter of about 92 billion light years, while the theoretical region where curvature can be observed is 250 times larger than our observed space.
An analogy can be drawn with the shape of the Earth. For many centuries, the Earth appeared flat due to a lack of empirical evidence. However, the curvature and spherical nature of the Earth can be observed on a large scale. If we consider three cities that are at least one degree of latitude apart, the sum of the angles of the triangle formed by these cities will always be greater than 180 degrees (a geographical degree is approximately 111 km in length, with a longitude degree being 111.13 km and a latitude degree being 111.32 km on average).
In contrast, the detected anisotropy of the cosmic microwave background radiation could suggest that the expansion of the Universe varied at distinct locations. Based on Einstein’s theory of general relativity, the geometry and curvature of spacetime are influenced by the type of matter and energy it contains.
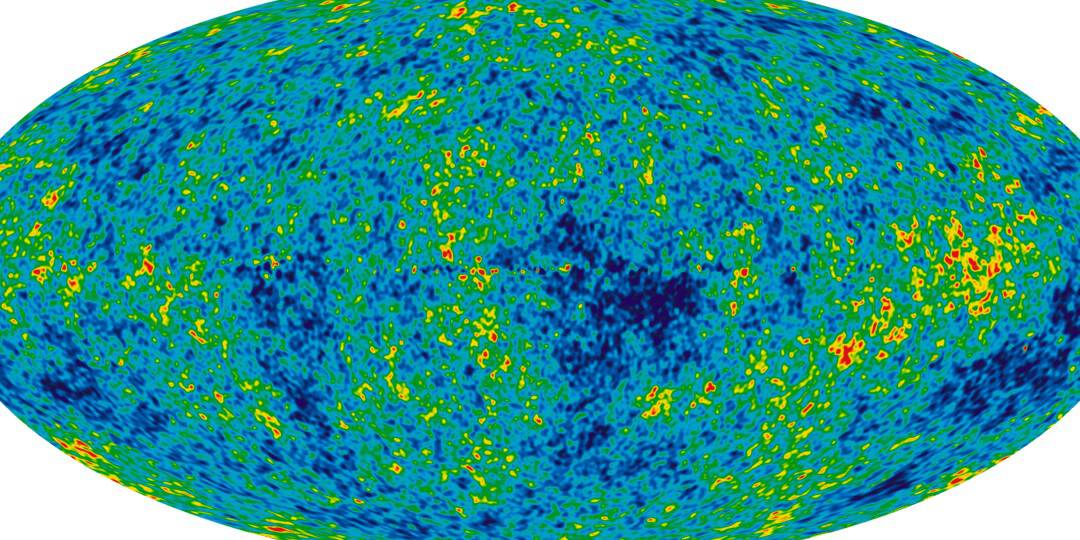
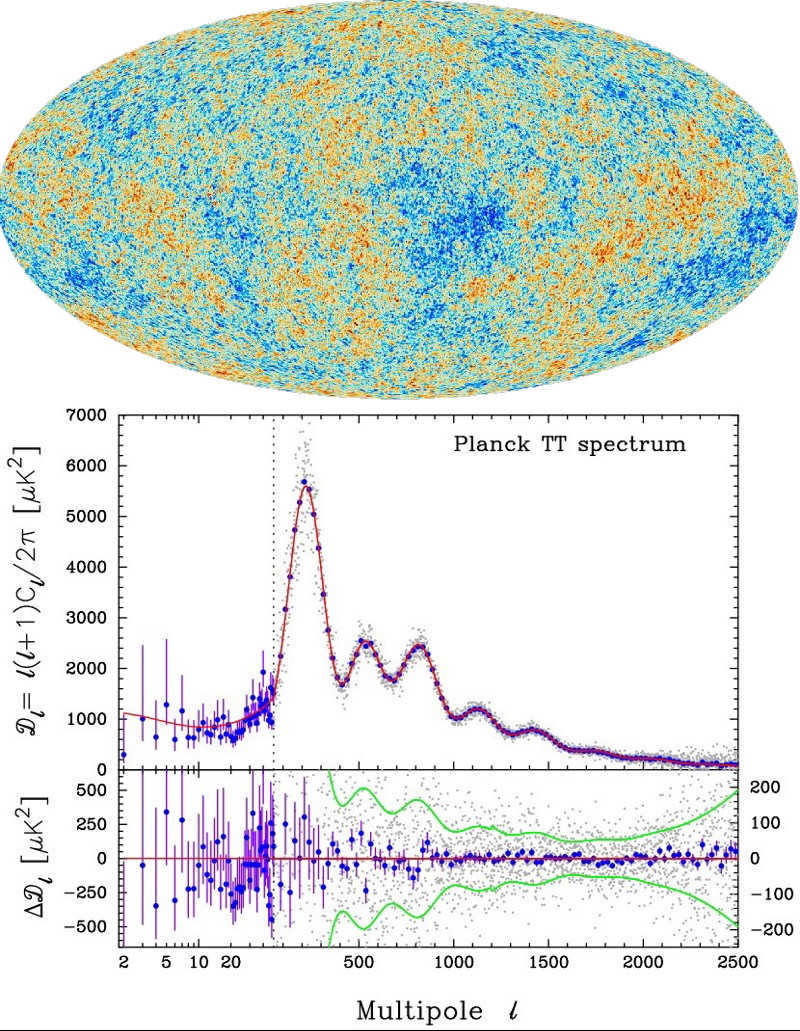
Displayed below is a chart illustrating temperature deviations measured by the Planck satellite, overlaid on a map depicting the cosmic microwave background radiation:
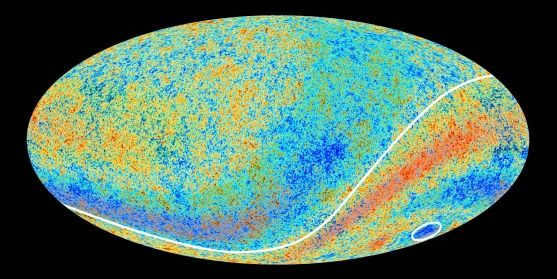
To begin with, the temperature distribution in the different hemispheres of the sky exhibits a clear asymmetry: the average temperature in the southern hemisphere is higher than in the northern hemisphere, however, it is in the southern hemisphere where an unusually cold region (within the oval) is also observed.
This observation does not align well with the classical inflationary model, as the rapid inflationary period should have effectively equalized such anomalies. The data from the Planck satellite does not challenge the concept of the universe’s expansion itself, but it does suggest that the expansion during the inflationary epoch was somewhat uneven.
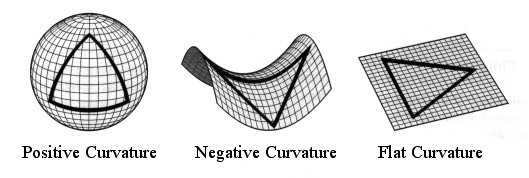
Variations in the Curvature of the Universe
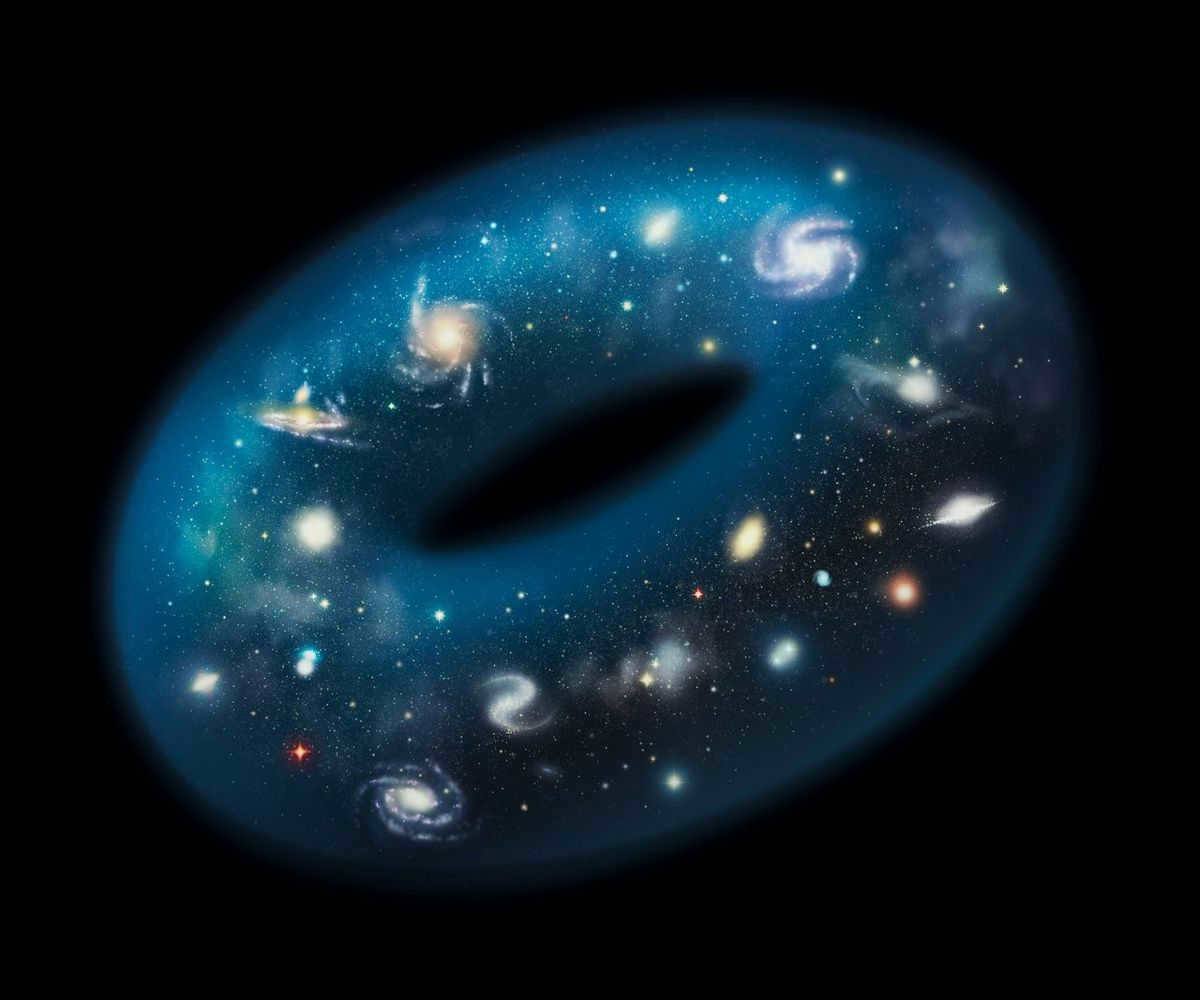
It is worth noting that there is a distinction between the curvature of space (negative curvature, positive curvature, flat space) and the topology of the Universe. The curvature can vary depending on the shape (topology) of the Universe. For instance, a torus (resembling a bagel) has a finite topology, yet its interior exhibits negative curvature.
In addition to the dodecahedral and toroidal topologies of the Universe, there are other possible topologies, especially if the shape of the Universe at its early stage depended significantly on quantum gravity and was filled with wormholes. However, for the purposes of this publication, let’s concentrate on three configurations that permit uniform expansion and could result in the observed “inflationary” scenario – spherical, saddle-shaped, or flat.
In a Euclidean Universe, parallel lines never intersect and the angles of a triangle always add up to 180°. However, in a spherical Universe, parallel lines, like meridians on a globe, do intersect and the sum of the triangle’s angles exceeds 180° (at distances much greater than the observed part of the Universe). On the other hand, in a hyperbolic Universe, the sum of the triangle’s angles is less than 180° and parallel lines also intersect. According to Einstein’s theory of relativity, the curvature of spacetime depends directly on the mass of matter in the Universe. It is important to note that this curvature is mainly influenced by the mass of dark matter and the amount of dark energy, rather than visible objects. Therefore, if the Universe has a relatively small amount of mass, it will have a saddle-shaped curvature and eventually collapse. Conversely, if the Universe has a large amount of mass, it will have a spherical curvature. Both a flat and spherical Universe can exhibit the expansion that we observe, which we can refer to as “decentralized”.
The overall structure of the universe is determined by the distribution of average density throughout the universe, which is directly related to the curvature of the universe. In the theory of general relativity, this is represented by the density parameter, which is the ratio of the observed density to the “critical density” necessary for a flat universe. A density parameter of 1 indicates a flat universe, while values greater than 1 indicate a convex or spherical shape, and values less than 1 indicate a concave or hyperbolic shape. Throughout the 20th century, it was widely believed that the density of space in our universe was exactly 1.
Connectivity is a significant topological characteristic of a figure, such as the Universe. It represents the number of non-intersecting contours that the figure possesses.
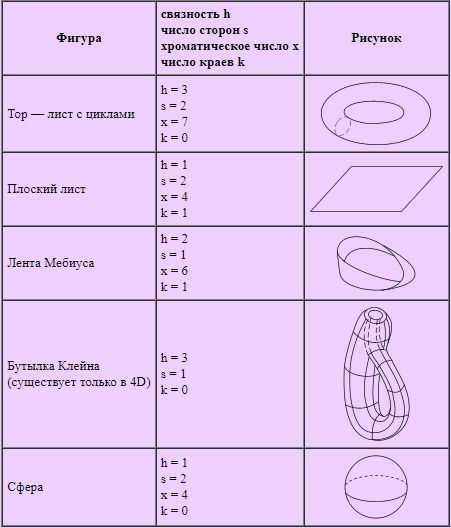
By default, it is assumed that the Universe, similar to a plane, is “single-connected” – meaning that there is only one possible path for a ray of light to travel from its source to the observer. If the universe were a Euclidean plane or had a hyperbolic shape, it would indeed be single-connected and infinite. However, it is also possible to envision a multi-connected Universe that takes the shape of a torus or a Klein bottle (as shown above), and in such a “multi-connected” Universe, light could travel along multiple trajectories simultaneously. In this scenario, an observer would witness several “images” of the same galaxy, but would consider them distinct, much like in a mirror maze.
Therefore, the configuration of the Universe is determined by its curvature, which can be assessed at intergalactic scales. The mass of the Universe is what determines its curvature. Moreover, if the Universe is multi-dimensional and expanding unevenly, it could result in irregularities in the temperature distribution of the cosmic microwave background radiation.
Measuring the Curvature of the Universe: A Guide
In the early 20th century, the advent of space telescopes revolutionized our ability to observe distant galaxies and attempt to determine the shape of the Universe. Drawing a parallel to the Earth’s curvature, we can see that its surface appears flat regardless of whether we are at sea level or atop a mountain. However, there are certain phenomena that cast doubt on the Earth’s flatness even at close distances, such as the gradual emergence of a ship from beyond the horizon. In medieval times, this phenomenon was attributed to atmospheric refraction.
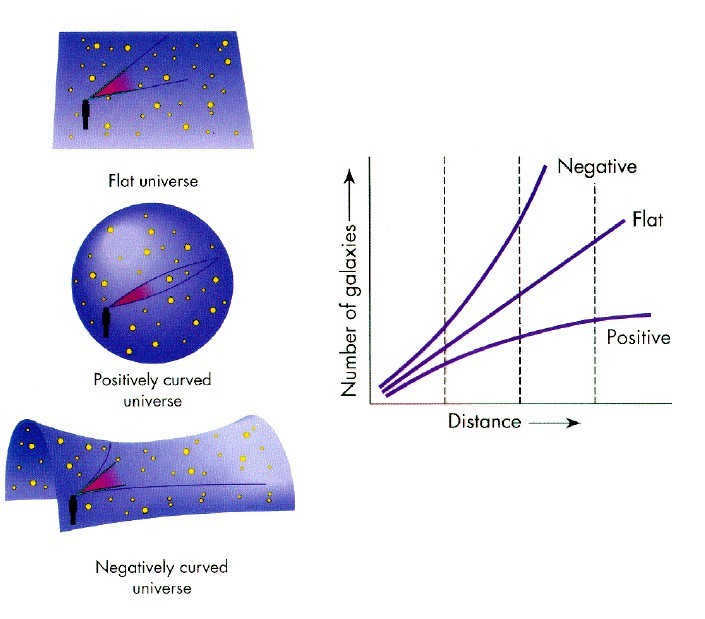
At present, there exist three methods for determining the curvature of the universe: luminosity, scale factor, and galaxy count. To measure the curvature using luminosity, it is necessary to identify light sources, such as quasars, that can serve as standard candles and then assess the curvature of the light rays emitted by them.
When determining the scale factor, it is important to consider the standard sizes of large objects that are far away, such as massive galaxies. Ultimately, we can examine the number of galaxies in a specific region of space as a function of distance.
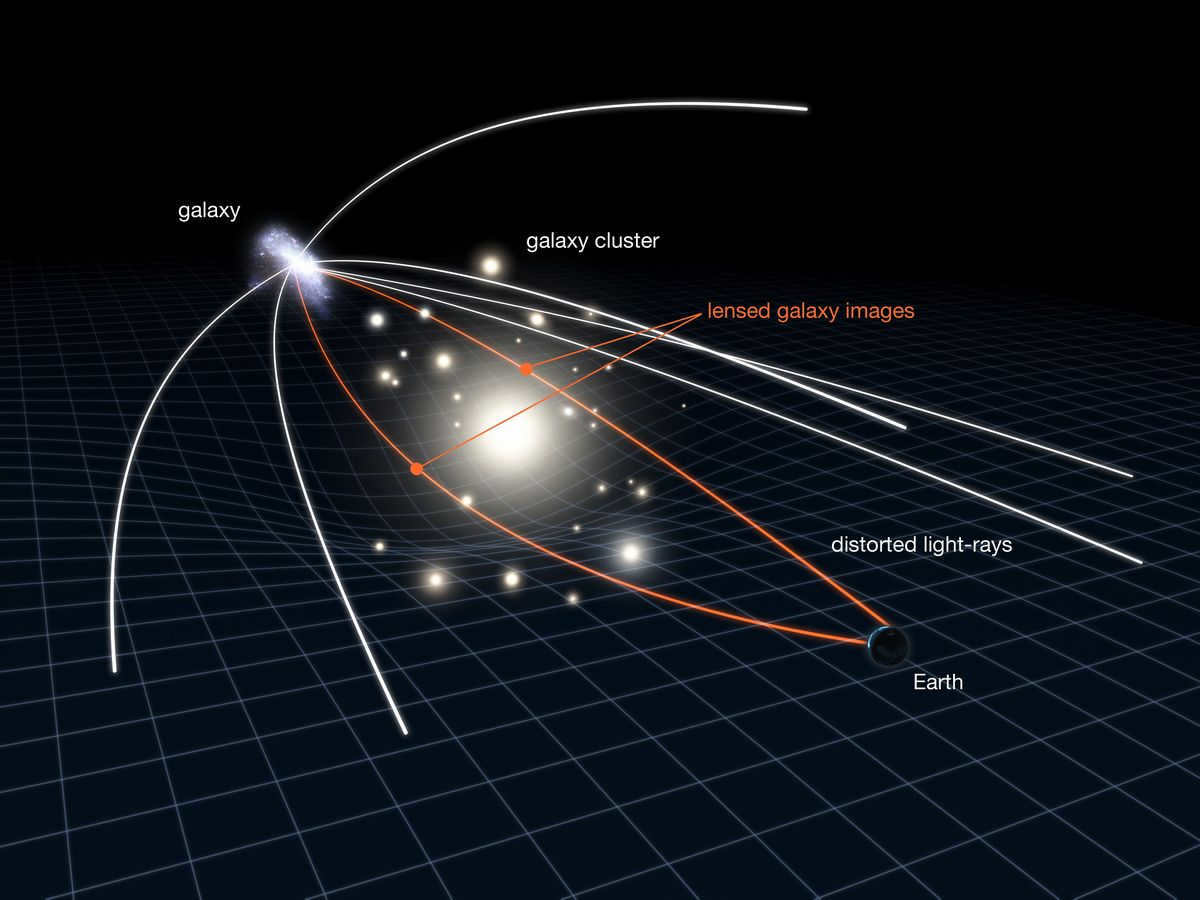
Current measurements of the curvature of space indicate that the observed portion of the Universe appears to be flat. The European Space Agency is planning to launch the EUCLID space telescope in July 2023, which will have the capability to measure the curvature of electromagnetic radiation up to 10 billion light years. One of the main objectives of the telescope is to further investigate the phenomenon of gravitational lensing and determine whether it is linked to the curvature of the Universe.
Paraphrasing on the Size and Growth of the Universe
It is evident that as the size of the Universe expands, its mass also increases. This statement can be restated as “space possesses mass” – on a cosmological scale, this likewise implies that space contains energy, as mass and energy are interchangeable in this context. The energy within space is also known as vacuum energy or dark energy. However, a paradox arises: as the universe expands, the density of three-dimensional space diminishes. As a result, the origin of the Universe’s mass being energized is not observable within three-dimensional space.
Brian Cox’s theory
Based on Einstein’s general theory of relativity, the concept of gravity is indistinguishable from acceleration, and gravity is essentially the result of space being curved. This groundbreaking discovery led Einstein to theorize the existence of black holes. Conversely, according to the special theory of relativity, the speed of light represents a fundamental limit, and any object moving at this speed would perceive time as standing still.
In his book “Wonders of the Universe,” Brian Cox proposes a different perspective on reality. He suggests that we could exist on a three-dimensional surface within a closed four-dimensional Universe, which is expanding uniformly at nearly the speed of light. Consequently, all points on this surface would be moving away from each other at the exact speed of light. This implies that our perception of time is actually the fourth dimension. Thus, an object that appears motionless in time would appear to us as if it were moving through space at the speed of light.
If we inhabit the exterior of the enclosed four-dimensional Universe, akin to a sphere (with a single connection) or a torus (with multiple connections), this structure has the potential to rotate. The resultant angular momentum from this rotation would be perceived as the enigmatic “dark energy” whose origin remains unknown. Additionally, under this interpretation, a typical black hole could manifest as a compact and authentic four-dimensional entity. If the event horizon of a black hole is a three-dimensional surface and the “radius” of a black hole extends into the fourth dimension (from our temporal perspective), then conventional matter that appears to fall into a black hole actually disperses within the three-dimensional event horizon.
Assuming that the configuration of our Universe in four dimensions resembles that of a sphere, torus, or Klein bottle, there exists a plausible explanation not only for its potential curvature but also for the peculiarities observed in the relic radiation. It is conceivable that during the inflationary period, we find ourselves within one of the rapidly expanding “bubbles” within the Multiverse.

According to Andrew Liddle from the University of Edinburgh, it is possible that our universe was influenced by the gravitational force of neighboring universes during the inflationary phase. Matthew Kleban’s research team from the State University of New York has also proposed that the anomalies in the structure of the cosmic microwave background radiation could be a result of a collision with a neighboring universe.
Therefore, in order to investigate and confirm these hypotheses, it is crucial to determine the curvature of our universe and the actual shape of the surrounding cosmic landscape. It is possible that the answers to these questions will emerge when we are able to explore a region of the universe that is 200-400 times larger in diameter than the currently observed part of the cosmos.
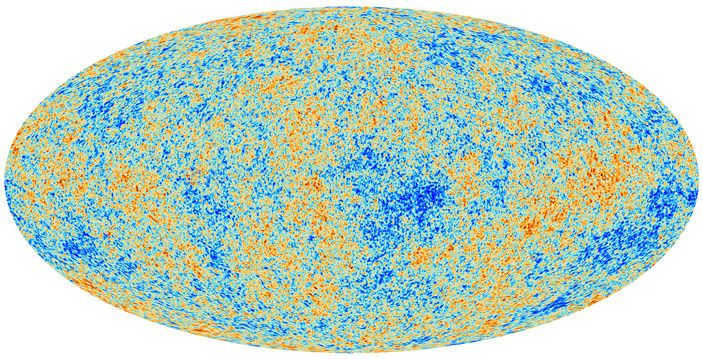
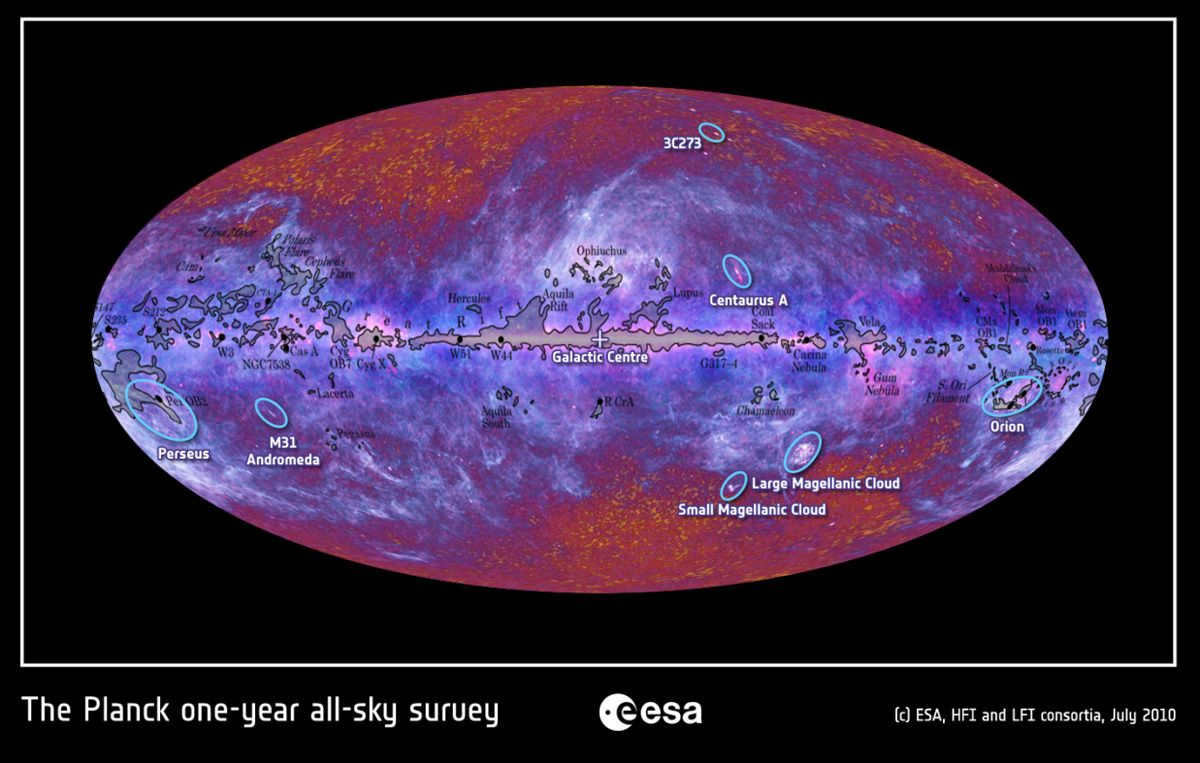
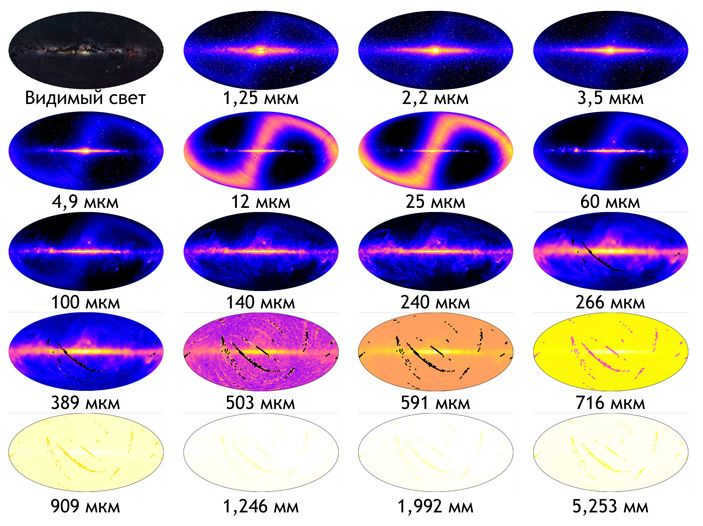
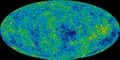
Figure 1. The map above shows the variations in relic radiation across the galaxy, based on data collected by the Planck Space Observatory. Regions depicted in blue indicate areas that are a few tens of microkelvins cooler than those shown in red. Image courtesy of esa.int
Relict radiation, also known as cosmic microwave background, is the residual light from the early stages of the Universe. Its study has played a key role in advancing our understanding of cosmology, confirming the Big Bang theory and providing valuable insights. However, this radiation also presents certain anomalies that scientists have yet to fully comprehend. One of the most intriguing mysteries is the existence of a cold spot, which has sparked intense debates among cosmologists.
Relic radiation
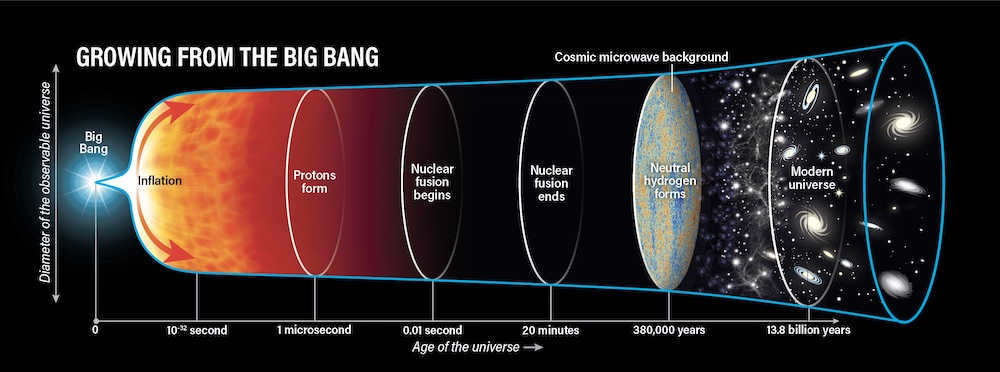
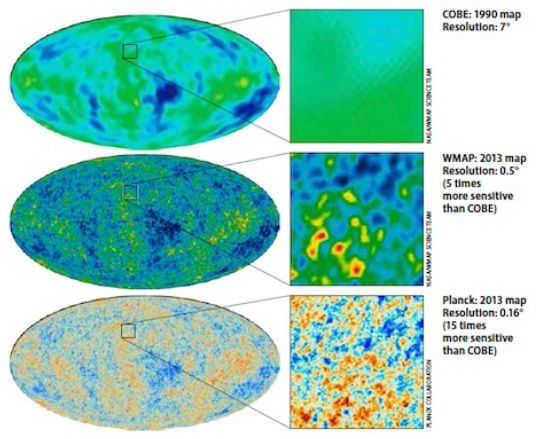
Based on the standard cosmological model, in the early stages of the Universe (a few seconds after the Big Bang and a few hundred thousand years later), it was filled with a hot plasma. This plasma consisted of free protons, electrons, and high-energy ionizing radiation (photons). Whenever a proton and electron combined to form a hydrogen atom, the photons would immediately destroy it. Over time, the Universe expanded and the density and temperature of the radiation decreased. Eventually, the energy of the photons was no longer sufficient to maintain the plasma. Protons and electrons were then able to form neutral hydrogen atoms, and the distance that photons could travel became greater than the size of the visible Universe. As a result, radiation separated from matter and, for the first time since the Big Bang, the Universe became transparent to it. The photons that were released during this time can still be observed today as relic radiation (Fig. 2).
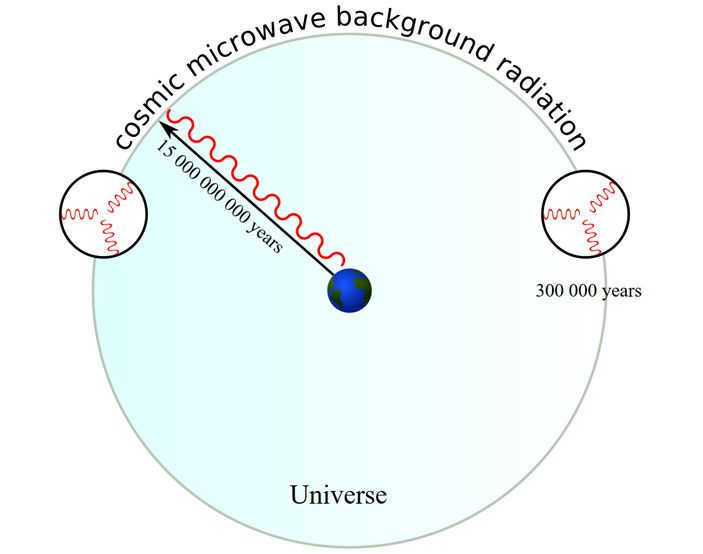
Fig. 2. Approximately 400,000 years after the occurrence of the Big Bang, there was a separation between radiation and matter (depicted as small circles with red wavelengths). Simultaneously, radiation was emitted in all directions from each point. Presently, nearly 14 billion years later (rounded up to 15 billion in the image), we can observe this ancient radiation emanating from all directions. Image sourced from en.wikipedia.org
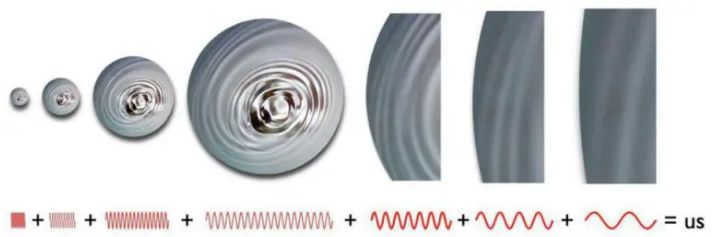
As a result of the expansion of the universe, the wavelength of the ancient radiation has now extended into the millimeter range, although at the time of its emission, it was approximately 1100 times shorter (refer to Cosmological redshift). Consequently, the temperature of this radiation today is 2.7 K, but at the time of its emission, it was about 3000 K. Ancient relic radiation dominates the contemporary Universe, meaning that there are significantly more of these aged photons even presently than there are photons emitted by all the stars (Fig. 3).
When discussing the temperature of relic radiation, we are referring to the frequency spectrum of this radiation resembling that of a completely black body with a specific temperature. The term “is” used here is not precisely the scientific term (as scientists assess how well the theory aligns with experimentation). However, upon observing the measurements of the relic radiation spectrum (Fig. 4), it is impossible to conclude otherwise. It is important to note that the displayed measurement errors have been multiplied by 400 – otherwise, they would be indiscernible. The measurement of the relic spectrum stands as the most precise measurement in the entire field of cosmology.
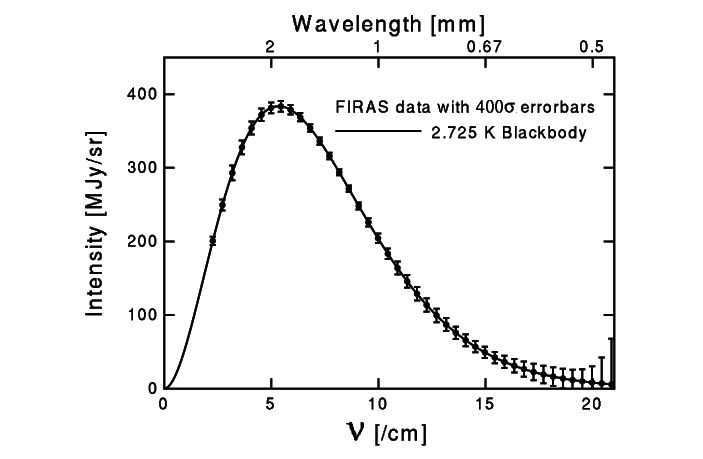
Figure 4. The FIRAS instrument measured the frequency spectrum of relic radiation, represented by data points with segments indicating errors. The spectrum was compared with the spectrum of a completely black body at a temperature of 2.725 K. The graph shows the intensity as a function of frequency on the lower horizontal axis, or as a function of wavelength on the upper horizontal axis. The measurement errors have been multiplied by 400.
The detection of relic radiation in 1964 by American radio astronomers Arno Penzias and Robert Wilson served as a significant validation of the accuracy of the Big Bang theory. Indeed, we witnessed firsthand the plasma of the fledgling Universe, a mere 400 thousand years old at the time (in stark contrast to its current age of approximately 14 billion years). Presently, as we persist in our observation of relic radiation, we gain a deeper understanding of the mechanisms that transpired during those nascent epochs.
Currently, the focus of experiments in the realm of observing relic radiation is centered on the examination of its anisotropy. As previously stated, relic radiation illuminates us from all angles. Photons comprising relic radiation possess a nearly identical temperature, regardless of their direction of origin (in other words, relic radiation is essentially isotropic). Nevertheless, there exist slight temperature variations along specific directions (thus creating anisotropy within relic radiation). The magnitude of these variations is quite minuscule: the typical deviation amounts to approximately 10^-5 of the average temperature of relic radiation (see Figure 1).
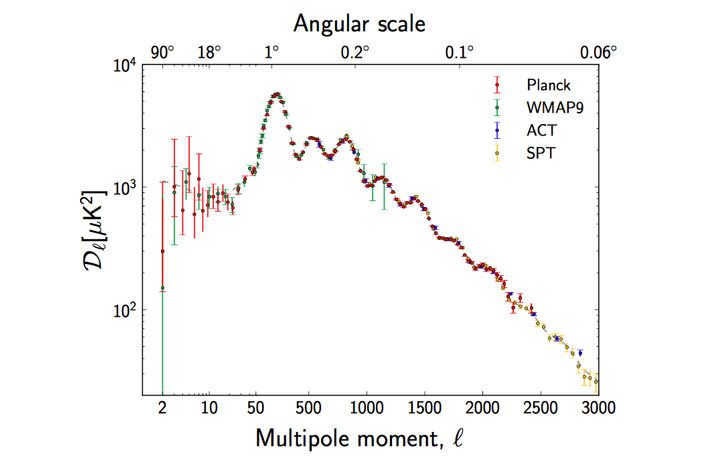
Fig. 5. The angular power spectrum of temperature fluctuations of relic radiation has been calculated using data from various projects including Planck, WMAP, ACT, and SPT. This power spectrum provides information about the correlation of fluctuations at different angular scales. For instance, a prominent peak at 1° (indicated by the upper horizontal axis; the bottom axis represents the multipole value: l = π/α, where α is the angle from the upper horizontal axis) signifies that the most common fluctuation size is 1°. The experimental data is compared to the standard cosmological model, which is represented by the gray dashed line. The graph is derived from the Planck Collaboration paper, 2013. Planck 2013 results. I. Overview of products and scientific results
One significant outcome of these measurements is the comparison between the measured power spectrum and the expected spectrum based on the standard cosmological model (which, to summarize briefly, posits that the Universe, composed of 70% dark energy and 25% dark matter, originated from the Big Bang 13.8 billion years ago). The agreement with the theoretical spectrum is observed with great precision, thereby affirming the accuracy of our Universe model.
Relic radiation’s cold spot
The distribution of relic radiation fluctuations across the celestial sphere is remarkably uniform: there is no noticeable variation in the size or intensity of red (or blue) spots in any particular region of the sky. However, there is one exceptional anomaly known as a “cold spot” (refer to CMB cold spot). This cold spot is situated in the southern hemisphere constellation Eridanus and spans approximately 5° in radius (refer to Figure 6). In the vicinity of the cold spot, the temperature of the relic radiation is 70 μK lower than the average temperature across the entire sky (whereas the overall average deviation is only 18 μK). At the center of the cold spot, the temperature experiences a drop of 150 μK. The existence of the cold spot was initially discovered in 2001 through the use of WMAP, a second-generation space microwave telescope (the first generation of experiments dedicated to studying relic radiation fluctuations occurred in the 1980s and 1990s, and now we are entering the fourth generation of such experiments).
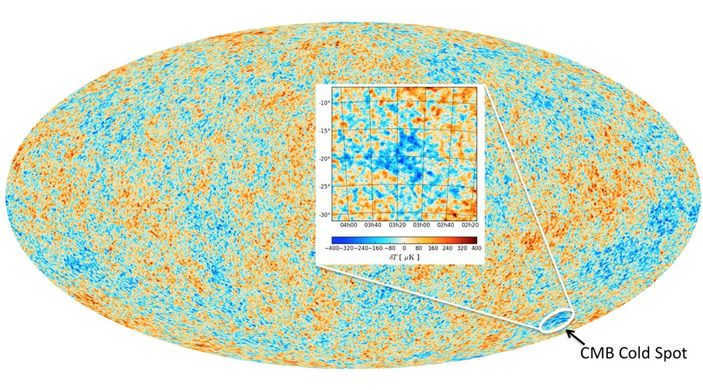
Figure 6. A representation of the relic radiation fluctuations in galactic coordinates, as observed by the Planck satellite. The cold spot is highlighted in the inset. This image is sourced from astronomy.com.
However, the primary issue does not solely lie in the temperature of the cold spot; rather, it is the size that presents a significant concern. When examining the relict radiation map, it is challenging to distinguish the highlighted cold spot as something out of the ordinary. One may assume that there are larger areas of both red (indicating heat) and blue (indicating cold). It is crucial to bear in mind that this image is a reconstructed representation of fluctuations in relic radiation. Any data located along the central horizontal line is actually concealed from our view by the radiation emitted by the Milky Way (refer to Fig. 3). To compensate for this, a complex process of merging sky maps at different frequencies is necessary to “subtract” the interference caused by our galaxy. This yields a comprehensive map of relict radiation; however, the regions obscured by the Milky Way are not particularly reliable and are typically excluded from analysis. The majority of visible spots in the map are situated in this uncertain region. Conversely, the cold spot resides in a clearly defined, accurately measured portion of the sky, far removed from the influence of the Milky Way. Furthermore, it is undeniably exceptionally cold.
To elucidate the peculiarity of the cold spot, let us introduce the notion of the cosmological horizon. The cosmological horizon denotes the utmost distance that a particle can traverse since the inception of the universe, assuming it is traveling at the velocity of light. This horizon serves as a boundary that delimits causally linked regions within the cosmos: given that information, encompassing any form of physical interaction, cannot propagate at a pace surpassing that of light, regions of the universe that are separated by a distance exceeding the cosmological horizon should be wholly detached from one another. At the time when the relic radiation became segregated, the size of the horizon corresponded to what it is today when measured at an angle of approximately 1 degree (it is worth noting that the initial peak on the power spectrum is precisely situated at the 1-degree mark). Therefore, it is profoundly peculiar to observe that within a cold spot, the temperature remains correlated even at significantly greater distances. It appears as though something occurred in that particular location that propagated at a velocity surpassing that of light.
According to scientists, it is believed that there was a phenomenon in the initial stages of the universe where space expanded at a rate faster than the speed of light. This phenomenon, known as inflation, took place approximately 10^-33 seconds after the Big Bang. As a result of inflation, we now observe uniform relic radiation across vast angular distances.
One common misconception surrounding the Big Bang theory is the idea that it originated from a singularity, which can be thought of as a point. This leads to questions like, “Where in the sky is the specific point where the Big Bang occurred?” However, there is no such point, and here’s why. The Universe is believed to be infinite, even though we are unable to observe its entirety. Additionally, we know that the universe is expanding, and if we trace back along the timeline, we can infer that it was contracting. So, if we were to compress infinity, at what point would it cease to be infinite and become “zero”? The answer is: it wouldn’t! Infinity remains infinite even when infinitely compressed. The same principle applies to the Universe: it was infinite at every moment, including the moment of the Big Bang.
But if the Universe has always been infinite, why does the relic radiation have nearly the same temperature across the entire sky? After all, we mentioned that the size of the observable universe is only about 1 degree! This implies that the relic radiation must consist of many causally unrelated regions. It is quite perplexing to see that these regions are so similar. This phenomenon is known as the horizon problem (see Horizon problem).
To address this problem (as well as several related issues), physicists Alan Guth, Andrew Linde, and Paul Steinhardt developed the theory of inflation. According to this theory, the entire observable universe we see today “inflated” from a small, causally connected region. Inflation theory is often considered part of the standard model of cosmology and suggests that between 10^-36 s and 10^-33 – 10^-32 s after the Big Bang, the Universe experienced a period of rapid expansion (followed by continued expansion without acceleration). While physicists have yet to reach a consensus on the exact mechanism behind this inflationary expansion, there are numerous experimental indications supporting its occurrence. Currently, the search for the final evidence of inflation – B-modes of polarization in relic radiation – is underway.
So, to sum up the interim findings. The relict radiation map reveals a peculiar anomaly – a cold spot. This cold spot stands out due to its significant size, approximately 5°, and low temperature. In fact, the deviation from the average temperature of the relict radiation is nearly 10 times greater in this region compared to other parts of the sky.
Void-based Explanation
The emergence of the cold spot can be accounted for in a minimum of two manners: we can posit that it originates from a certain process in the early universe, or we can investigate what might have left an imprint on the remnant emission at subsequent periods. Let’s first delve into the latter possibility.
The most straightforward approach to elucidating the manifestation of the cold spot is to hypothesize the presence of a void in the arrangement of galaxies in that particular direction. It is widely acknowledged that galaxies in the cosmos construct a vast-scale configuration comprised of clusters, filaments that connect them, and voids that separate them.
Computer simulations of the standard cosmological model reveal the vast structure of the Universe. Each individual point of light represents a galaxy. The depicted region spans over 100 million light years in size.
How does the presence of the cold spot in the universe relate to the concept of the void? Let’s consider a scenario where a photon of relic radiation travels through a void. When the photon enters the void from an area with a higher gravitational potential, it experiences gravitational redshift and loses energy. In other words, the photon needs to expend energy to escape the gravitational potential well. As the photon exits the void, it regains some of the lost energy. However, in an expanding universe, the gravitational potential will have decreased by the time the photon leaves the void, resulting in the photon not fully regaining its lost energy. As a result, voids have a cooling effect on relic photons. Conversely, clusters have a warming effect on relic photons. On average, these effects balance each other out. However, if we have a large void in close proximity, the cooling of relic photons may become noticeable.
An explanation that is more favored for the formation of the cold spot is the presence of a void near us, rather than an anomaly in the early universe. This is because the horizon is much larger today than it was back then, meaning that anisotropy in the nearby vicinity is more likely than in the distant vicinity. In a 2016 article titled “Cosmic troublemakers: the Cold Spot, the Eridanus superwade, and the great walls” by András Kovács and Juan García-Bellido, the authors claim to have discovered a void in the direction of the Cold Spot. This article builds upon previous research on this topic, including a paper by István Sapudi, András Kovács, et al. The detected void in the constellation Eridanus is exactly as expected: it is narrow and very long, extending from us to a redshift value of z = 0.3. This means that at the far edge of this void, we can observe a Universe that is 1.3 times smaller than the present one, measuring about 800 Mpc.
The conclusion presents a paradox. While the Eridanus void and the cold spot are undeniably linked due to their shared position in the sky, the observed void alone does not provide enough evidence to support this connection conclusively. Could it be that there is indeed a connection, but uncovering it requires a comprehensive reassessment of our cosmology? If so, the cold spot could hold the key to unveiling thrilling new insights in the realm of physics!
Hold on, don’t rush. There might not be any recent discoveries in physics yet. In a research paper published in April 2017 titled “Evidence against the existence of a void associated with a relic cold spot” (R. Mackenzie et al., 2017. Evidence against a supervoid causing the CMB Cold Spot), Istvan Sapudi and his colleagues already mentioned that the Eridanus void is not as large as previously thought. According to their calculations, it is only 100 Mpc in size and has a density that is 34% less than the surrounding Universe. While the Eridanus void does appear to be more empty based on these calculations, it can only account for a 6 μK decrease in the temperature of the relic radiation. In the direction of the cold spot, there are a few other smaller voids, but their combined effect is far from what is desired.
To explain the discrepancies in various studies, it is important to understand the challenges involved in measuring distances to galaxies. While the position of a galaxy in the sky can be accurately determined through telescope observations, measuring its distance is a more complex task. Constructing a three-dimensional map of the sky relies on two well-measured coordinates and one poorly-measured coordinate. Determining distances requires measuring redshift, which indicates the extent to which the Universe has expanded since light from a distant galaxy was emitted. Redshift serves as a measure of distances at ultra-far distances, starting at approximately 100 Mpc. It is determined from the spectra of stars, with the term “redshift” referring to the shift of the luminosity spectra of distant objects towards longer wavelengths (resulting in a redder appearance). Therefore, measuring redshift requires the use of instruments that are sensitive to the wavelength of the emitted light, rather than a simple telescope.
Two approaches are commonly used: photometric and spectrometric. In the photometric approach, the telescope observes the sky at multiple wavelengths, capturing each wavelength separately (similar to how a digital camera captures red, green, and blue colors separately). This approach allows for the simultaneous study of all objects within the telescope’s field of view. However, it tends to have lower sensitivity in terms of spectrum analysis. On the other hand, the spectrometric approach involves using a spectrometer to analyze the spectrum of each object individually within the telescope’s field of view. This approach provides excellent spectrum measurements but can be challenging to apply to all visible objects (as measuring the spectrum of each object requires time, albeit a relatively short amount of time). Thus, researchers must choose which objects to prioritize for spectrum analysis. Both methods have their own sources of error: photometry has an error in measuring redshift, while spectrometry has an error due to limited sampling. In the first paper discussed, both photometric and spectrometric measurements were used, with a greater emphasis on spectrometric data for small redshift values (in the near-redshift region). The catalogs utilized in this study contained nearly 100 thousand galaxies, although the majority of them were situated at redshifts of z < 0.1. The second paper focused on spectrometric data up to redshift values of z = 0.4, but the authors were only able to study 7000 galaxies.
To summarize. The issue of the cold spot and the corresponding void in the local region of the Universe is one of the “hot” topics in modern cosmology. It is hoped that in the near future, this question will either be definitively answered or will lead to significant discoveries. Currently, it is evident that there is a relatively sparse region in the direction of the cold spot, although the extent of this region depends on the data used in the analysis. However, it appears that this sparsely populated region, known as the Eridanus void, is not sufficiently large and empty to account for the existence of the cold spot. Whether these two phenomena are connected remains uncertain. In general, the observation of the expansive Eridanus void also serves as an intriguing subject for further research. However, its connection to the cold spot remains unclear. Once again, it is worth noting that these two cosmic anomalies – the Eridanus void and the cold spot of relic radiation – have occurred in the same location in the sky. Is this merely a coincidence? Perhaps, or perhaps not. Further investigation is necessary.
A process in the early Universe explained
Now let’s explore more unusual scenarios for the origin of the cold spot. These assume that the cold spot developed shortly after the Big Bang. During this time, which we know very little about, it is believed that approximately 10 -32 seconds after the Big Bang, the inflationary epoch occurred, during which the Universe rapidly expanded. Even earlier, about 10 -36 seconds after the Big Bang, there was a period when the strong, weak, and electromagnetic forces were combined. However, we lack a comprehensive theory that can explain the processes that took place during this epoch. And even earlier, before the 10 -43 second mark, there was the enigmatic Planck epoch. We still have no understanding of what space and time were like during this period. Various hypotheses and speculations about these early epochs propose intriguing concepts such as cosmic strings or monopoles. The cold spot could potentially serve as evidence of such an early phenomenon, if, for instance, there were irregularities in space-time textures (M. Cruz et al., 2007. A Cosmic Microwave Background Feature Consistent with a Cosmic Texture) or inconsistencies in the inflationary field (Juan C. Bueno Sánchez, 2014. The inflationary origin of the Cold Spot anomaly).
One possible explanation that is unconventional proposes that during the initial stages of the inflationary period, our universe encountered another universe, resulting in the emergence of the Cold Spot (K. Larjo, T. S. Levi, 2009. Bubble, Bubble, Flow and Hubble: Large Scale Galaxy Flow from Cosmological Bubble Collisions). In various interpretations of inflation theory, it is assumed that we inhabit a separate bubble-universe and that there exists a vast multitude of other bubbles where the evolution of the universe may have followed a completely different trajectory. If our bubble collided with another bubble at the onset of inflation, it is conceivable that we would observe a distinct spot or disc-like structure on the remnant radiation (imagine residing in a soap bubble that intersected with another bubble: a slight intersection would result in a spot, while a strong intersection would form a ring). Thus, the cold spot could potentially serve as the initial observable phenomenon that reflects the extraordinary physics of the early Universe, including string physics.

Figure 7. Inflation theory suggests that our existence is within a distinct bubble-universe, and within these bubbles, there may exist other universes. Figure from bbc.com
However, it is important to keep in mind that the cold spot could simply be a random occurrence. If we consider the physical parameters of our world and conduct numerous random universe simulations, approximately one in every 50 simulations will exhibit a similar cold spot. This probability is not as low as it may seem.
Concluding, it is important to mention that the initial assumption that the cold spot is highly unusual is not entirely unquestionable. How was it determined that this specific formation was abnormal in the first place? In order to establish this, a function resembling a Mexican sombrero was applied to the observed map of relic temperature variations. By using different sombreros, anomalies of various angular sizes can be identified. This analysis demonstrates the uniqueness of the cold spot. However, what exactly is the analysis responding to? It appears that the analysis is not only reacting to the low temperature at the center of the spot, but also to the surrounding ring of elevated temperature. Without that ring of heat, the significance of the cold spot would be diminished. Nevertheless, even in that scenario, the cold spot remains an extraordinary and misunderstood anomaly.
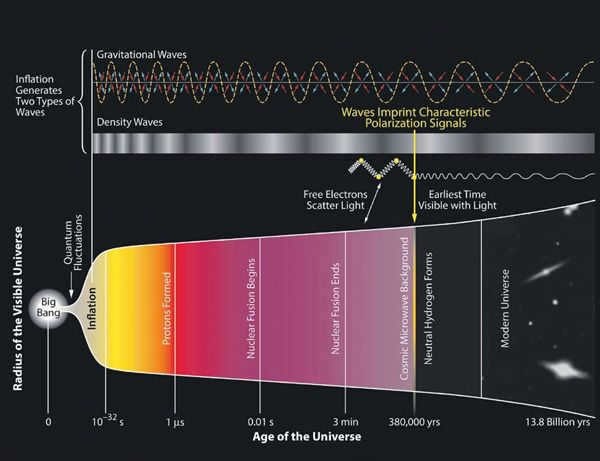
A groundbreaking announcement was made on March 17, 2014: the detection of gravitational waves! The more reputable media outlets clarified that these were relic or primordial gravitational waves, and their existence was confirmed indirectly through microwave relic radiation. The most cutting-edge sources further emphasized that this discovery validates the theory of cosmological inflation, shedding light on the origins of the universe. So, what exactly occurred and what is the profound significance of this momentous discovery?
Queries raised by the initial cosmological upheaval
The confirmation of the Universe’s inception through the Big Bang was thoroughly substantiated in 1964 with the detection of relic radiation. In fact, even prior to this discovery, there were few skeptics, but this revelation unequivocally solidified the idea. Thus, the initial cosmological revolution, which commenced in 1915 with the formulation of the general theory of relativity, came to a resolute conclusion.
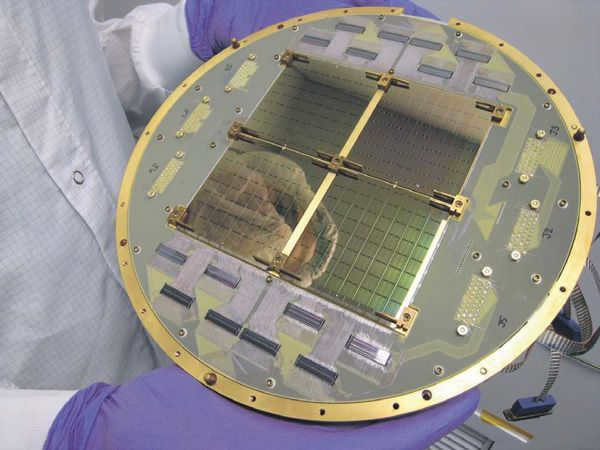
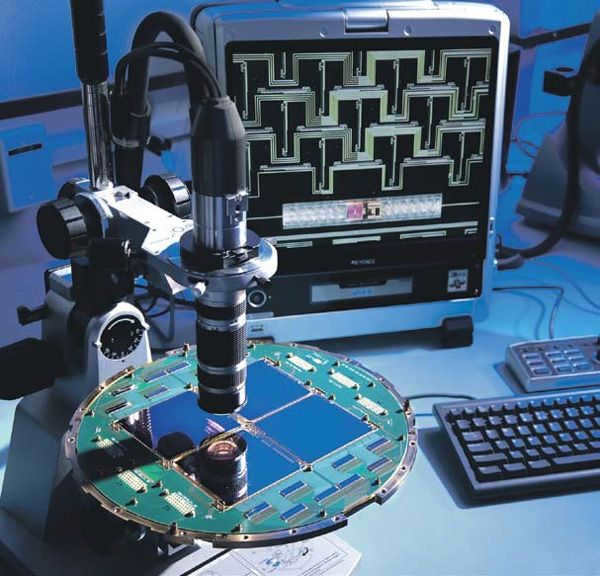
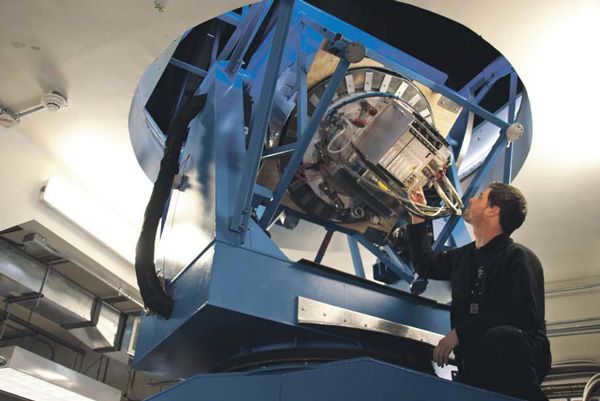
The BICEP2 radio telescope’s focal plane is made up of 512 superconducting microwave detectors that were designed and produced at NASA’s Jet Propulsion Laboratory. This image was captured by NASA/JPL-Caltech and is available on the www.jp l.nasa.gov site.
- Why is the Universe uniform in all directions? Despite the fact that different regions of the Universe were initially unaware of each other due to the limitation of the speed of light, and therefore were not causally connected, they somehow started expanding simultaneously and ended up being so similar.
- Why were the parameters of the Big Bang so precisely fine-tuned that the Universe didn’t collapse or disintegrate in its early moments, but rather gradually slowed down after billions of years? To put it more precisely, why is the Universe so remarkably “flat”?
- What triggered the initial event of the Big Bang?
A New Era in Cosmology
The next stage involved the realization of a quite apparent truth: the process of inflation does not come to an end with the creation of the Universe, but instead persists indefinitely, giving rise to an endless array of universes, both similar and entirely distinct from one another. While there are additional elements to this narrative, the perennial challenge remains of determining where to establish boundaries.
A disturbance in the fabric of space-time
Discovered in 1964, relict radiation is essentially the emission of light from the plasma that filled the universe when it was 380,000 years old. At that point, the plasma transitioned into a neutral gas that is transparent to photons. This transition is scientifically known as recombination. The plasma at 380 thousand years acts as a barrier, blocking anything further away from us in time and distance, making it opaque to electromagnetic waves and preventing us from detecting other waves. This plasma can be likened to a screen, and the map of relict radiation serves as a snapshot of this screen. What can we observe on this map? For nearly three decades, there was no significant observation. The universe is only homogeneous on very large scales, such as 300 million light years or more. On smaller scales, we can see clusters and superclusters of galaxies, as well as “walls” and “voids”. How did this structure come into existence? If the universe was initially perfectly homogeneous, it would not have formed this way. There must have been initial inhomogeneities that later condensed into galaxies and their clusters. These inhomogeneities should be visible on the map of relict radiation. However, for a long time, until the early 1990s, the map appeared uniformly smooth without any details. It seemed like cosmology had hit a dead end. In the early 1990s, researchers finally noticed the subtle variations in the map. The contrast was small, only 10 to the power of 5, but it was enough to explain the structure of the universe. How did these inhomogeneities arise? It turns out that inflation played a role as well. The inhomogeneities that gave rise to galaxies and their clusters are the result of quantum effects. The formation of massive galaxy clusters can be attributed to quantum fluctuations that occurred during inflation! This may sound unbelievable, and in the past, many cosmologists were skeptical, but it is now widely accepted. All the inhomogeneities in the universe originated from quantum fluctuations as small as 10 to the power of -27 cm, which were then stretched by inflation by many orders of magnitude. As the universe expanded, these fluctuations grew in size by almost 30 orders of magnitude. Through gravitational instability, they became more pronounced, eventually condensing into galaxies and their clusters.
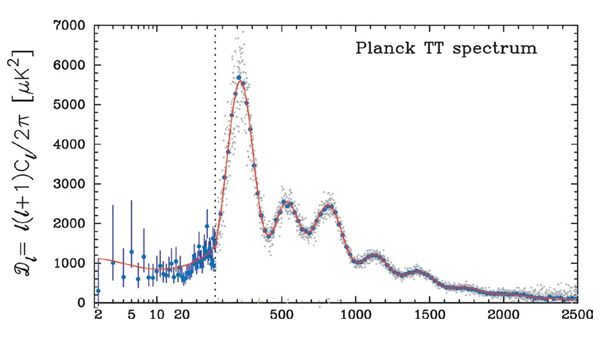
Figure 1. The power spectrum of temperature fluctuations in the relic radiation, as measured by the Planck satellite in 2013 (ESO 2013).
The inflation theory’s predictions were fully validated when the relic emission map was captured with the highest precision by the WMAP and Planck instruments. This occurred recently, with the final results of WMAP being published at the end of 2012 and the initial results of Planck being released in early 2013. The agreement between the theory and the observations was resoundingly successful. Fig. 1 illustrates the power spectrum of relic radiation irregularities, which is derived from decomposing the relic radiation map using angular harmonics. The waves in this spectrum result from a fascinating phenomenon known as “Sakharov oscillations” or “Acoustic oscillations” – which we discuss in our article with Valery Rubakov in “TrV-Nauka” № 83 on July 19, 2011. The remarkable aspect is that the theory (represented by the continuous curve) with just six adjustable parameters aligns so well with such a complex observed pattern. This suggests that cosmologists possess a comprehensive understanding of the events and processes that occurred in the early universe. Additionally, a portion of the theory that relates to cosmological inflation is linked to the data. Specifically, it pertains to the spectrum of primary irregularities generated by inflation, a calculation first performed by Vyacheslav Mukhanov and Gennady Chibisov in 1981. Therefore, the triumphant agreement of theory and experiment illustrated in Fig. 1 is also a triumph for the inflation theory. However, the overall picture remains incomplete as only the confirmation of scalar perturbations has been achieved thus far. The theory predicts something else as well.
An important piece of information that is not present
The quantum fluctuations that occurred during the period of inflation not only led to variations in density, but also resulted in the creation of gravitational waves that continue to exist today. Even before the development of inflation theory, Leonid Grischuk demonstrated that gravitational waves were produced in the expanding Universe. Later, Alexei Starobinsky provided a quantitative description of this process specifically for cosmological inflation. Similar to scalar density perturbations, gravitational waves were stretched by the inflationary “conveyor belt” from lengths of 10^-27 cm to a wide range of scales. However, unlike microwave radiation (a relic from the recombination epoch that occurred 380,000 years after the Big Bang), gravitational waves are a direct relic of the epoch of cosmological inflation that preceded the Big Bang by 10^-35 s. The theory of inflation is supported by numerous facts and arguments, but there is still room for alternative explanations regarding the origin of the Universe. The detection of relic gravitational waves could potentially provide the definitive proof needed for the theory of cosmological inflation and even warrant a Nobel Prize. The amplitude of relic gravitational waves is too small to be detected by man-made instruments, but the plasma of the recombination epoch, which acts as a barrier separating us from the early Universe, can serve as a detector. This plasma can “record” the presence of gravitational waves in the relic radiation through two methods: polarization and the spectrum of its variations. Polarization of the relic radiation occurs during the final Compton scattering of photons on electrons, resulting in the photon having a linear polarization perpendicular to the scattering plane. In a homogeneous and stationary medium, there is no polarization, as it is washed out due to the lack of a preferred direction. However, the inhomogeneity and complex motion of the medium, as observed in the relic radiation map from WMAP and “Planck,” leads to the presence of polarization. The connection between polarization and gravitational waves will be explored further.

Jonathan Kaufman, a graduate student, refills the supply of liquid helium, which is necessary for the proper operation of the BICEP2 sensors that record the cosmic microwave background. The photo was taken by Jeffrey Donenfeld and can be found on ucsdnews.ucsd.edu.
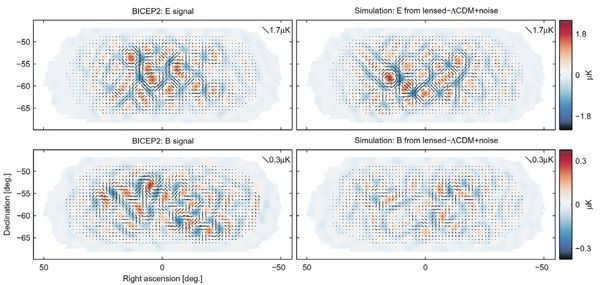
It appears that gravitational waves exhibit a distinct pattern of polarization compared to regular irregularities. These contributions can be distinguished and isolated. In essence, the polarization picture in the sky can be represented as a field of vectors with both direction and length. This field can resemble an electric field, which can be seen as a result of a static distribution of charges. Similarly, it can resemble a magnetic field, induced by a static distribution of currents. These fields are clearly differentiated in the realm of differential geometry. The first type of field is referred to as the E-mode, while the second is known as the B-mode. Any arbitrary polarization field can be broken down into E- and B-modes. Interestingly, it turns out that the B-mode is only associated with gravitational waves and not plasma irregularities and their acoustic oscillations. However, there is a hurdle when it comes to detecting the B-mode: gravitational lenses. These lenses consist of galaxy clusters and elements of the Universe’s large-scale structure. The issue is that these lenses, by altering the trajectory of relic photons, partially convert the E-mode into the B-mode. It is crucial to be able to separate the effect of gravitational waves from the background of the lensing effect. There are a couple of other challenges, which will be discussed below. Another way to detect the primary gravitational waves is through the Sachs-Wolf effect. When a photon passes through perturbations in the gravitational field, it experiences a change in frequency, resulting in a red or violet shift – this alters the temperature of the relic radiation. The effect is more pronounced for large-scale perturbations. Therefore, the Sachs-Wolf effect should raise the power spectrum of the irregularities in Figure 1 – to the left of the main peak (l = 50, 150).
Previously recorded information
So far, no evidence of relic gravitational waves has been observed using either of the aforementioned methods. Only upper limits have been recorded. The contribution of relic gravitational waves is traditionally defined as the ratio between the power spectra of tensor perturbations (generated by gravitational waves) and scalar (ordinary) inhomogeneities, denoted as r. The most stringent upper limit comes from analyzing data from the WMAP and Planck missions: r < 0.12 (at the 95% confidence level), which is nearly identical for both instruments. This limit is determined through power spectrum analysis (see Fig. 1). If gravitational waves were to have a larger contribution, the experimental data points on the left side of the plot would deviate from the theoretical curve. This limit has already raised doubts about certain inflation models, particularly the simplest ones. Among the current models, Starobinsky’s model best fits this limit, although it is not the only one. This model predicts a value of r ~ 0.005. If this prediction holds true, it may take several more years before relic gravitational waves are discovered. Regardless of the magnitude of the effect, observers will eventually reach that level, but it will take time. The tightest constraint on gravitational waves comes from the B-mode measurement obtained by ground-based microwave telescopes: r < 0.78 (at the 95% confidence level). This data is from the BICEP experiment conducted at the South Pole. The latest iteration of this experiment, BICEP2, is responsible for the current excitement.
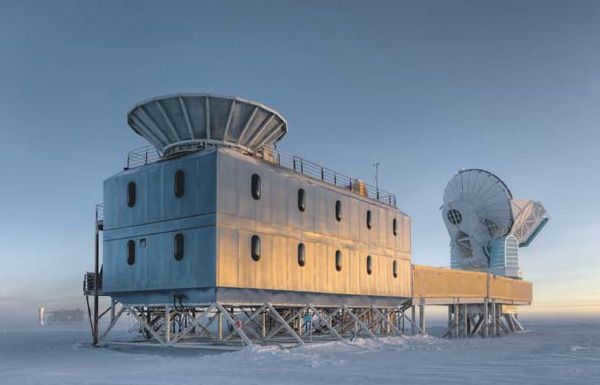
BICEP2 is a relatively compact microwave telescope that offers a limited angular resolution of just 0.5 degrees. However, it compensates for this by boasting remarkably low noise levels and exceptional sensitivity. To achieve such performance, the telescope’s primary components are cooled using liquid helium. The recently published findings are the result of measurements conducted over a span of three seasons, from 2010 to 2012.
Glasses tinkling and uncertainties
Comments on the discovery are filled with a sense of triumph. The detection of relic gravitational waves is a groundbreaking achievement, effectively confirming the theory of inflation and revolutionizing our understanding of the cosmos. At first glance, the result appears to be reliable. However, unlike the successful theory and experiment conducted by the WMAP and Planck missions, there are still lingering questions in this case. The main question being: does this result contradict the data obtained from the aforementioned experiments? In simpler terms, is the signal from gravitational waves unusually large? The value of r ~ 0.2 aligns well with the basic versions of the inflation theory but deviates by three standard deviations from the upper limit established by the Planck mission based on the Sachs-Wolf effect. The probability of the result deviating randomly by three standard deviations is incredibly low, only two chances in a thousand. However, it’s worth noting that the restriction r < 0.12 is only valid if we assume that the distribution of relic radiation irregularities in terms of angular size (power spectrum) follows a pure power law. If we abandon this assumption, the contradiction can be significantly alleviated. The BICEP2 preprint includes a figure from the Planck results paper that removes the assumption of a purely stepped spectrum. This suggests a potential agreement between the two. The author has consulted experts on this matter and a clearer picture emerges. The agreement between BICEP2 and Planck would require a significant bending of the power spectrum, which would go against the established theory. If we don't make this adjustment, the Sachs-Wolf effect would cause a noticeable deviation in the spectrum shown in Figure 1 on the left (l < 150) by approximately 10%, contradicting the data. Is there a possibility of an experimental error that overestimates the result? The first possibility that comes to mind is underestimating the effect of gravitational lensing, which can mimic B-mode signals. However, extensive research and computer programs exist to model and study the effects of lensing. Could there be a hidden trap here?
Justus Brevik, a PhD candidate, is examining the reading electronics of the BICEP2 instrument. The photo was taken by Steffen Richter from Harvard University and can be found on the website www.cfa.harvard.edu.
The authors of the research paper explore an alternative potential source of the background that imitates the observed effect: polarized dust in our Galaxy, where the particles align themselves with the cosmic magnetic field. When photons scatter off this dust, they acquire polarization that can mimic any mode. BICEP2, however, cannot distinguish this contribution as it only detects a single frequency. The Planck satellite, on the other hand, has the capability to isolate this background. The authors of the e-print acknowledge that there is currently no map of the dust distribution in the specific region of the sky under investigation, but it is expected to be available in the upcoming Planck release. In the meantime, they rely on dust distribution models and are confident that this background is relatively insignificant for their main findings. Nevertheless, it is important to listen to experts who caution that the role of polarized dust may not be as straightforward as it seems, and this is where potential complications may arise. However, speculating and jumping to conclusions is not productive, as it is unlikely that the question regarding the unusually large contribution of relic gravitational waves will remain unanswered for long. Firstly, the upcoming release from the Planck mission will provide clarification on the background of polarized dust. Secondly, similar experiments are being conducted simultaneously, including those at the South Pole, which will investigate other regions of the sky and yield independent results. Undoubtedly, significant efforts will be devoted to examining various effects that may influence measurement outcomes. Therefore, it is unlikely that we will have to wait long for answers. Let’s attempt to summarize. This research presents a substantial claim for a groundbreaking discovery that has the potential to conclude the cosmological saga that began over three decades ago. While celebrations have already begun, it would be prudent to exercise some patience before proclaiming the final victory of the cosmological revolution. Not all loose ends have been tied up and doubts have not been completely dispelled. Nevertheless, even if the findings are not ultimately confirmed, they will still serve as a valuable catalyst, inspiring a breakthrough in this pivotal field. This has been the pattern in cosmology thus far.
Fields of Study: Origins of the Universe and Its Development Phases, Observational Cosmology Other terms: Microwave Background Radiation, Cosmic Microwave Background, Cosmic Microwave Background Radiation.
Relict radiation (also known as cosmic microwave background radiation or CMB) is a type of cosmic electromagnetic radiation. It has a spectrum that resembles that of a completely black body, with a temperature of T = 2,725 K. This radiation contributes significantly to the overall intensity of the background radiation in the Universe, particularly at centimeter, millimeter, and submillimeter wavelengths. One of the key characteristics of relict radiation is its high degree of isotropy, meaning that its intensity is uniform in all directions to an accuracy of 10^-5. The discovery of relict radiation by A. Penzias and P.V. Wilson in 1964-1965, for which they were awarded the Nobel Prize in 1978, provided experimental evidence that supported the hot Universe theory and lent further support to Friedmann’s cosmological model.
Origin and range of residual radiation
Based on the theory of the hot Universe, the matter in the expanding Universe was much denser and hotter in the past. When the temperature was greater than 10^8 K, the primary plasma, which consisted of protons, helium ions, and electrons, interacted with radiation in complete thermodynamic equilibrium, continuously emitting, scattering, and absorbing photons. As the matter expanded, the temperature of the plasma and radiation decreased. Eventually, there came a point where the interaction between particles and photons did not have enough time to significantly affect the radiation spectrum due to the expansion. When the temperature was still above 3000 K, the primary matter was fully ionized, and the range of photons between scattering events was much smaller than the event horizon of the Universe. At approximately 3000 K, protons and electrons recombined to form hydrogen, causing the plasma to become neutral, and the Universe became transparent to radiation. As the Universe continued to expand, the temperature of radiation continued to decrease, but the blackbody (Planckian) spectrum of radiation remained as a relic or “memory” of the early stages of the Universe’s evolution (Fig. 1).
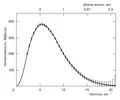
Figure 1 displays the spectrum of relic radiation in the form of data points, where the error of the experimental points has been magnified by a factor of 400. The solid line represents the spectrum of a completely black body with a temperature of 2.725 K, as documented in BRE, Volume 20. The energy of photons in relic radiation is significantly lower in the modern era, approximately 3 thousand times less than the energy of photons in visible light. However, the abundance of photons in relic radiation is incredibly high. There are approximately 10^9 photons of relic radiation for each baryon in the Universe. The density of relic photons is measured at 415 cm^-3.
The properties of relic radiation are unlike any other types of radiation, including the radiation from stars, radio galaxies, hot intergalactic gas, and re-radiation on interstellar dust. Its spectrum does not resemble the spectra of these sources, and its total energy far exceeds that of any other radiation. The high degree of isotropy observed in relic radiation, along with these unique properties, provides strong evidence for its cosmological origin.
Anisotropy of the Cosmic Microwave Background
The anisotropy of the cosmic microwave background (CMB), which is caused by the motion of the solar system in relation to the CMB, exhibits a dipole pattern. The temperature of the CMB is found to be 3 mK higher than the average in the direction towards the constellation Leo on the celestial sphere, and 3 mK lower in the opposite direction towards the constellation Aquarius. This indicates that the Sun, along with the Earth, is moving at a velocity of approximately 370 km/s relative to the CMB. By considering the velocities of the Sun’s motion around the center of the Milky Way and the motion of the Milky Way within the Local Group of galaxies, we can determine the velocity of the Local Group with respect to the CMB, which is estimated to be around 600 km/s.
The anisotropy component of the relic radiation associated with the motion of the Galaxy relative to this radiation is unpredictable and cannot be determined through modeling considerations. The cosmological anisotropy of the radiation is more complex and depends on the orientation on the celestial sphere, but it is not influenced by frequency. In 1992, an amplitude of 10 -5 on an angular scale of 10° was observed in the cosmological anisotropy of radiation, and in 2000, it was observed on smaller scales. The Planck space observatory conducted important studies on the anisotropy of the relic radiation from 2009 to 2013. These studies helped to refine our understanding of the Universe’s geometry, confirm the existence of non-baryonic matter, and determine the values of the main cosmological parameters with approximately 1% accuracy.