
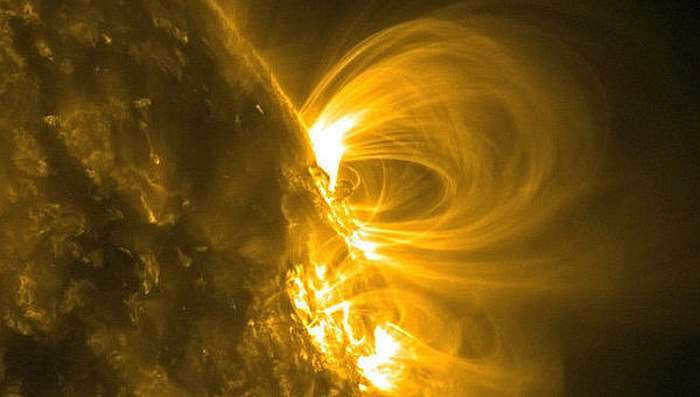
The Sun’s outer atmosphere is clearly visible in the ultraviolet range of the spectrum. This wavelength allows us to observe solar plasma flares and the changing corona of fire. Additionally, dark coronal holes can be seen between bright flares, which is where solar wind particles originate.
It is possible to observe fibers (filaments) and prominences of the colder plume of plasma using this wavelength. These structures are located above the visible surface of the Sun and are usually invisible at other wavelengths or appear as indistinct dark lines. However, in the ultraviolet range, we can observe their precise pattern, with bright dots indicating areas with a high density of red-hot solar plasma.
Images captured at this specific wavelength provide real-time visuals of the Sun’s coronal loops, which extend away from its surface along magnetic field lines. The areas that appear brighter indicate regions with stronger magnetic fields.
These images also reveal the most dynamic regions of the Sun’s outer atmosphere. The bright areas in the pictures display various activities taking place in the corona, such as flares and coronal mass ejections, while the darker regions represent coronal holes.
Solar Dynamics Observatory SDO
The SDO satellite, also known as the Solar Dynamics Observatory, has emerged as one of NASA’s most popular projects. At regular intervals of 10-12 seconds, the spacecraft’s instruments capture high-resolution photographs of the Sun using various wavelengths. On Earth, the raw data is received by two 18-meter diameter antennas situated in New Mexico.
These photographs are then regularly updated on online screens, ensuring that we can observe the Sun’s ever-changing dynamics around the clock. With these highly detailed images, we are able to discern objects that are smaller than 400 km in size.
A brief background
On February 11, 2010, a satellite was launched into space with the primary objective of continuously monitoring the Sun across 12 different wavelength bands. Known as the Solar Dynamics Observatory (SDO), it was initially planned for a five-year mission. However, NASA continues to receive valuable images from the SDO. Positioned in geosynchronous orbit, the SDO captures high-precision images of Earth, enabling scientists to study changes in the outer layers of the Sun’s atmosphere and to analyze the connection between coronal flares and processes on our planet.
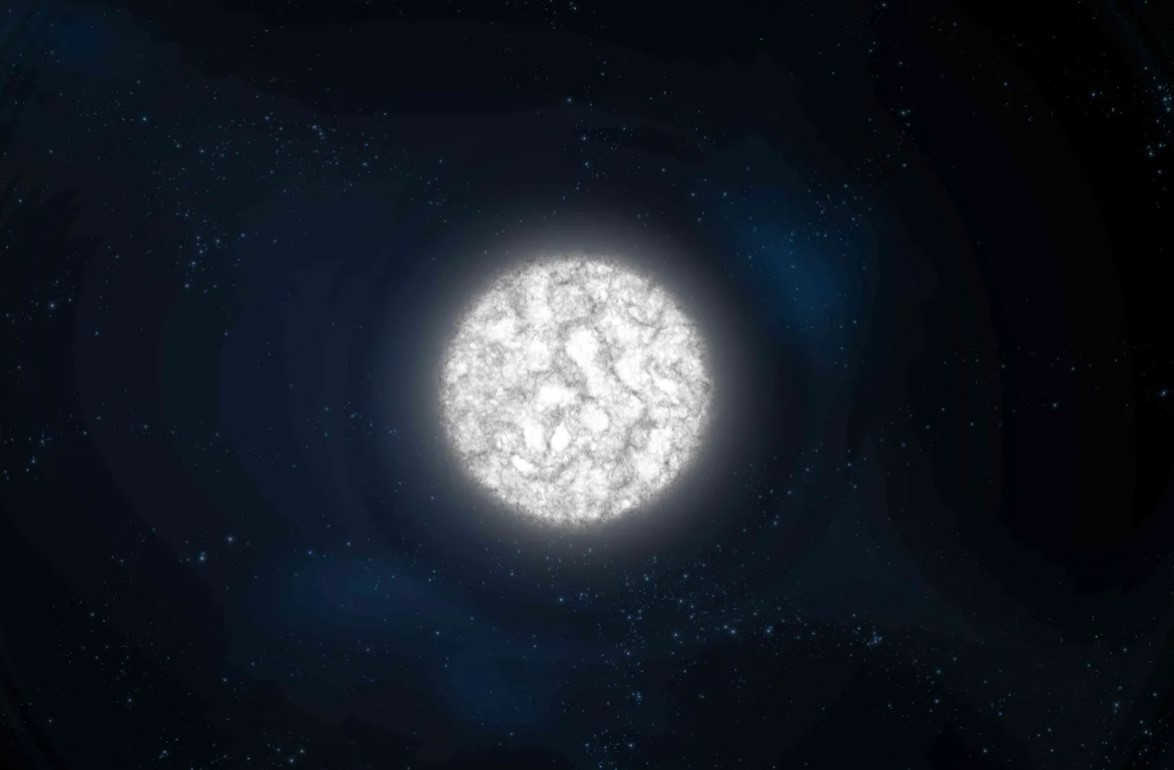
Briefly about the Sun
Coronal emissions and flares are two separate phenomena. An emission contains plasma made up of protons and electrons, with a mixture of helium, oxygen, iron, and other elements. Flares are a form of radiation that can be classified into five different classes based on their power: A, B, C, M, X. The A class represents the lowest level of X-ray radiation (0.0) – 10 nanowatts per square meter, and each subsequent class is ten times more powerful.
Sunspots are regions on the Sun’s surface where the plasma temperature is lower. The temperature difference can be as high as 1500 degrees.
The solar wind is a stream of ionized particles that spreads throughout the solar system, filling the space between planets.
On our website, we provide real-time updates on four waves, which are particularly fascinating due to the rapid changes in processes occurring on the Sun.
You have the opportunity to observe our online space weather, which primarily relies on the behavior of our star. The information is sourced directly from the SDO satellite and is frequently updated, ensuring that you are always aware of the precise conditions regarding our Sun’s activity and space weather.
Current Solar Activity
The information presented below is sourced from the AIA instrument on the Solar Dynamics Observatory (SDO) and is intended to offer high-quality visuals of the corona. These visuals capture a minimum of 1.3 solar diameters across multiple wavelengths, with a resolution of approximately 1 arc second.
The AIA instrument’s primary objective is to enhance our understanding of the physics of the solar atmosphere, which influences space weather. By generating the necessary data, the AIA instrument enables quantitative analysis of coronal magnetic fields and plasma. This leads to a deeper comprehension of observed processes and the development of advanced forecasting tools that benefit everyone.
Displayed below are real-time images showcasing the Sun’s activity online today.
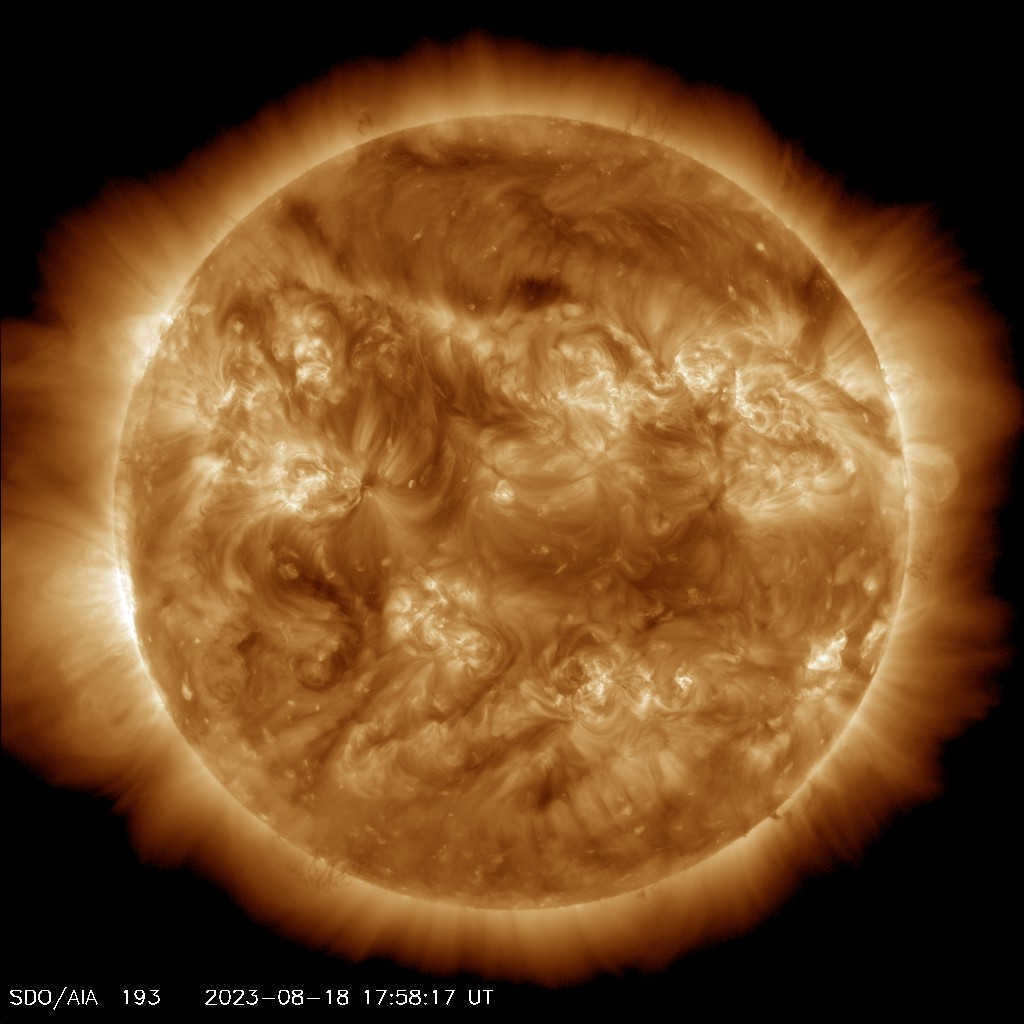
The wavelength, which covers the corona, is 193 angstroms, indicating a temperature of approximately 1.2 million degrees Celsius.
The condition of space weather within our solar system is contingent upon our star. The primary factors involved include flows of ionized plasma, intense radiation and flares, as well as the solar wind.
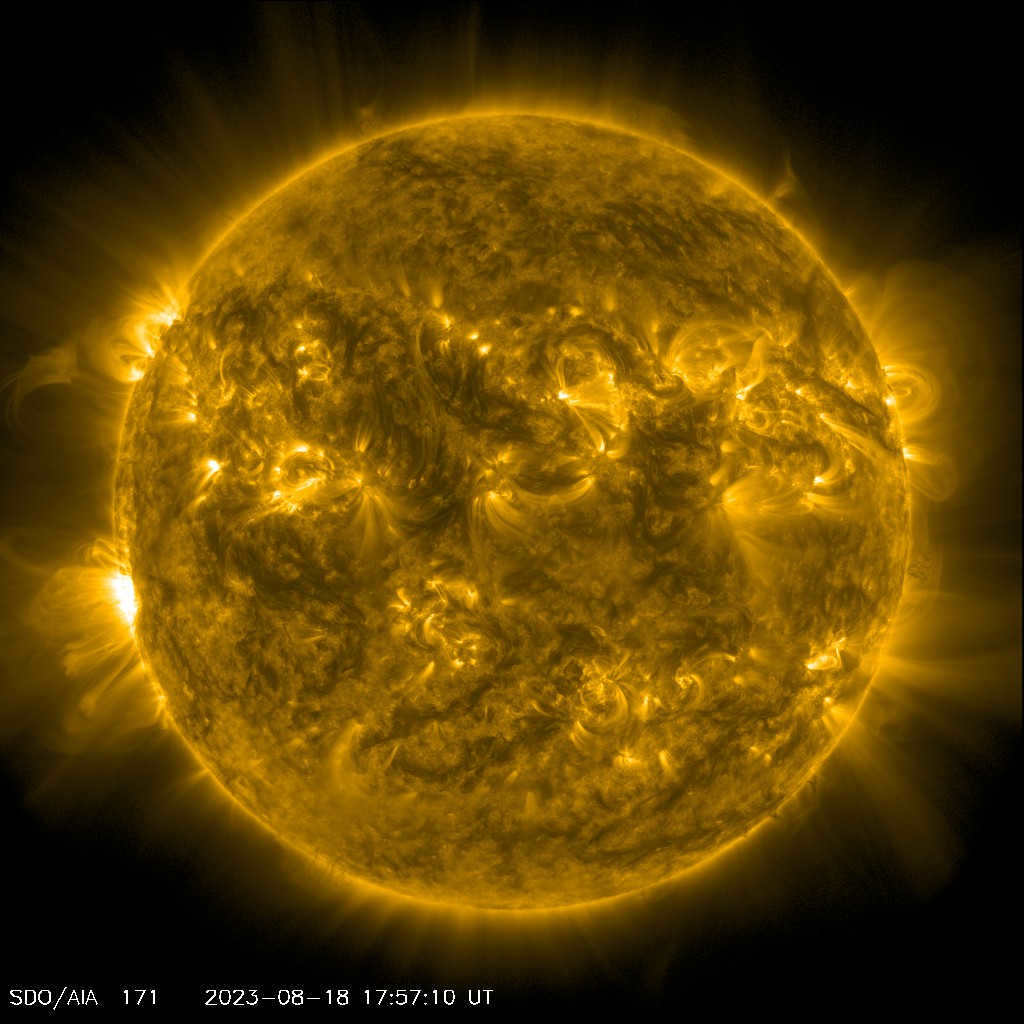
The wavelength of this image is 171 angstroms, which captures the calm corona and corresponds to a temperature of approximately 0.6 million degrees.
The wavelength of 304 angstroms is used to observe the transition layer and chromosphere, which indicates a temperature of approximately 50,000 degrees Celsius.
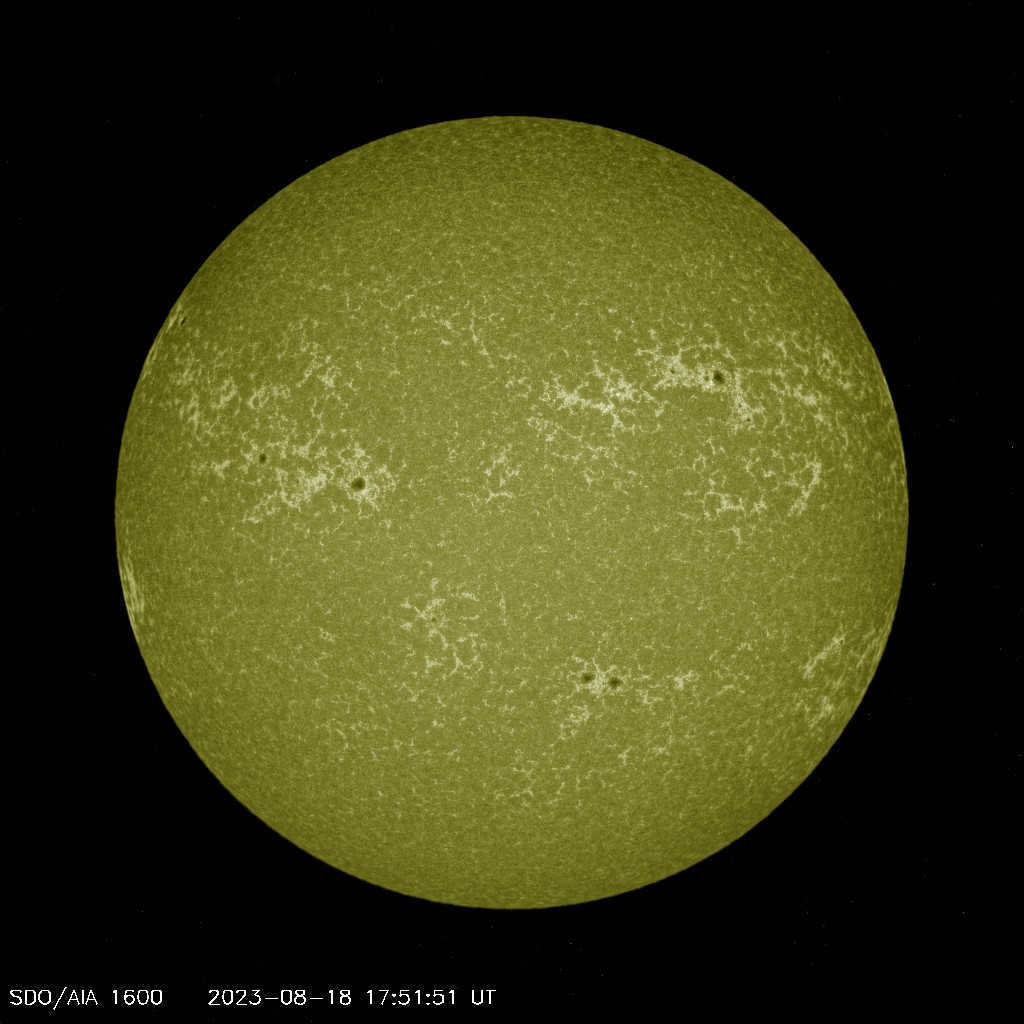
A wavelength of 1600 angstroms (transition layer and upper photosphere), which corresponds to a temperature of about 5000 degrees.
Graph of online space weather activity
Includes the following parameters: proton plot (data from the GOES-14 satellite). Updates every 5 minutes.
Parameters for solar wind and magnetic field near Earth
The chart below displays data on solar wind and magnetic fields. They are updated every 15-20 minutes. They provide a comprehensive view of solar wind speed and other parameters in the space near Earth.
Current status of solar activity
(Extreme – indicated by red color [Dst < -100 nT], Increased – indicated by yellow color [-50 nT >Dst > -100 nT], Medium – indicated by green color [-20 nT > Dst > -50 nT], Low – indicated by blue color [Dst > -20 nT])
The black arrow signifies the present value of solar activity for today.
Enjoyed reading this? Share it with your friends!
Currently, alongside terrestrial devices, numerous satellites have been deployed to monitor our star: SOHO, SDO, Stereo A and B. The following visuals present the present condition of the Sun from space in various wavelengths.
The image is refreshed every day. From time to time, there is a chance that the satellite’s cameras might be switched off.
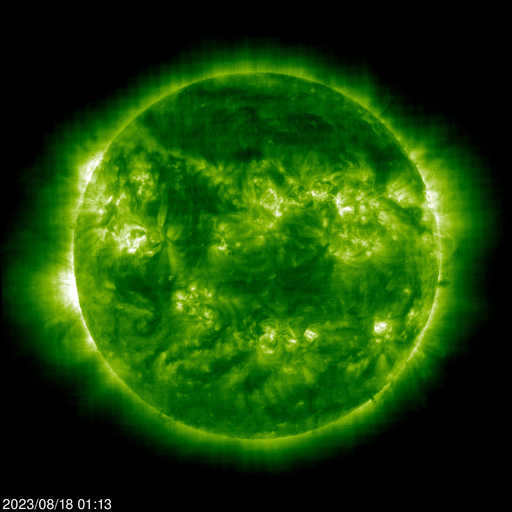
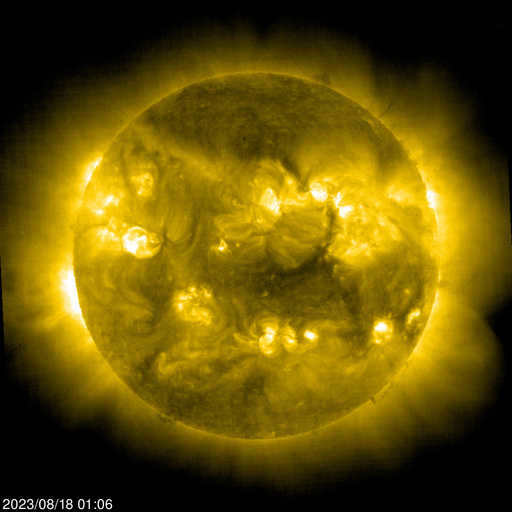
The Sun is captured in the ultraviolet range at a wavelength of 171 angstroms, indicating a temperature of approximately 1 million degrees.
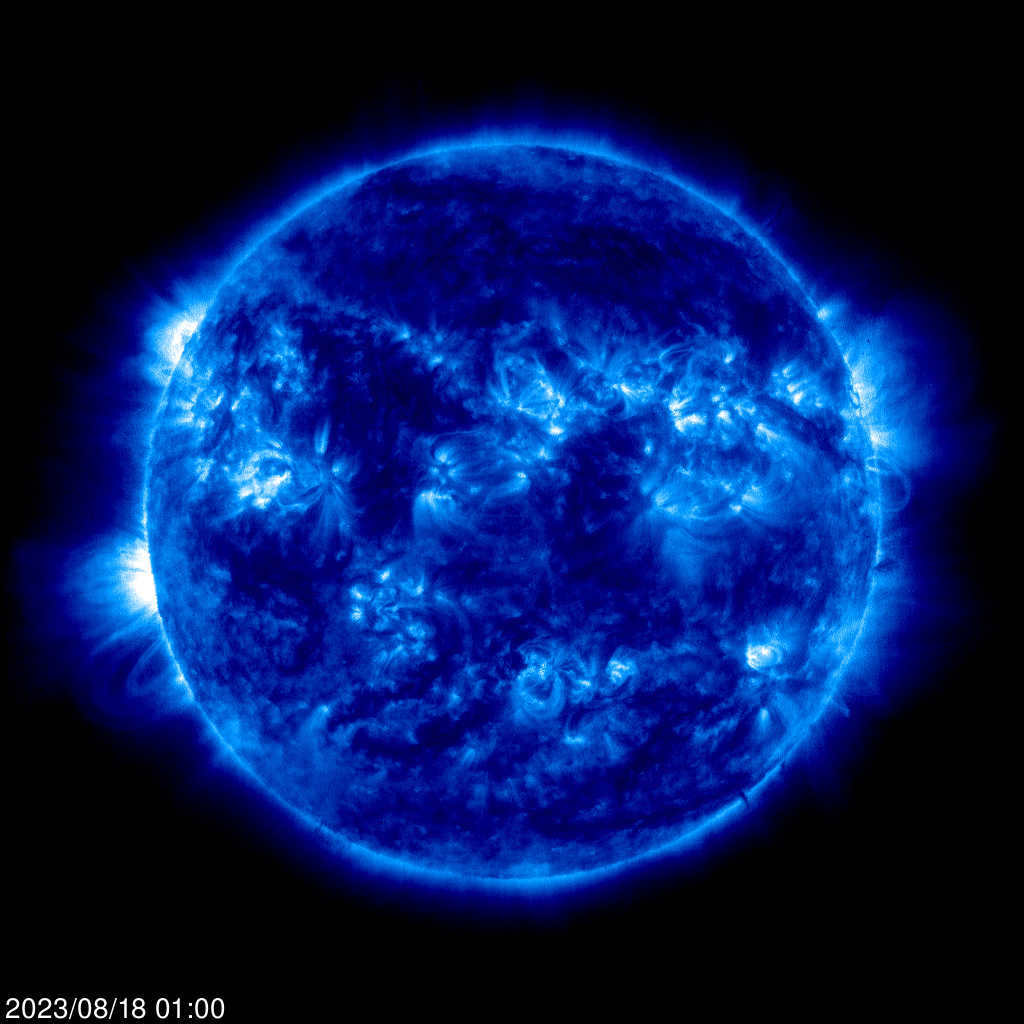
The current location of the sun is emitting ultraviolet radiation at a wavelength of 195 angstroms, indicating a scorching temperature of approximately 1.5 million degrees.
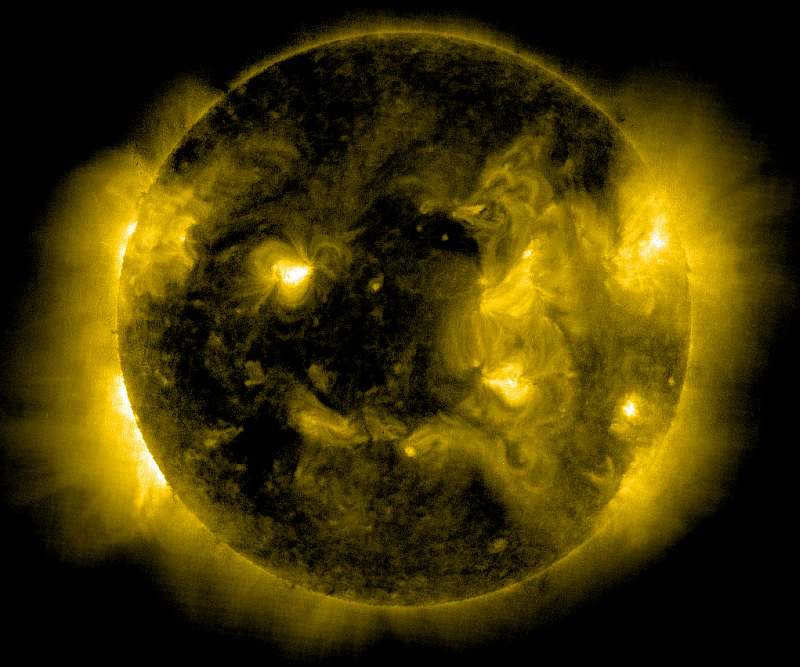
The sun is currently emitting ultraviolet radiation at a wavelength of 284 angstroms, which corresponds to a temperature of approximately 2 million degrees.
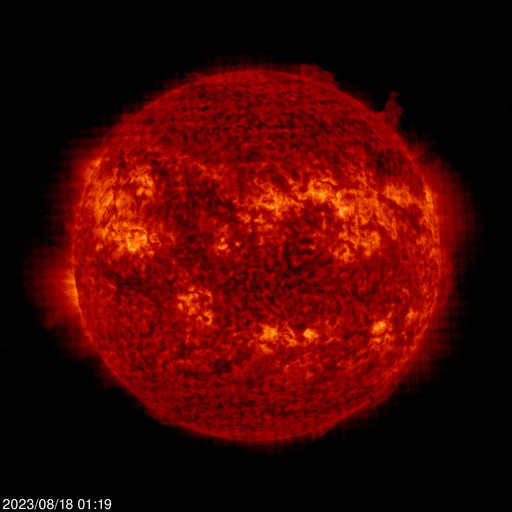
At a wavelength of 304 angstroms (in the ultraviolet range), the Sun exhibits bright spots that have a temperature ranging from 60,000 to 80,000 degrees Celsius.
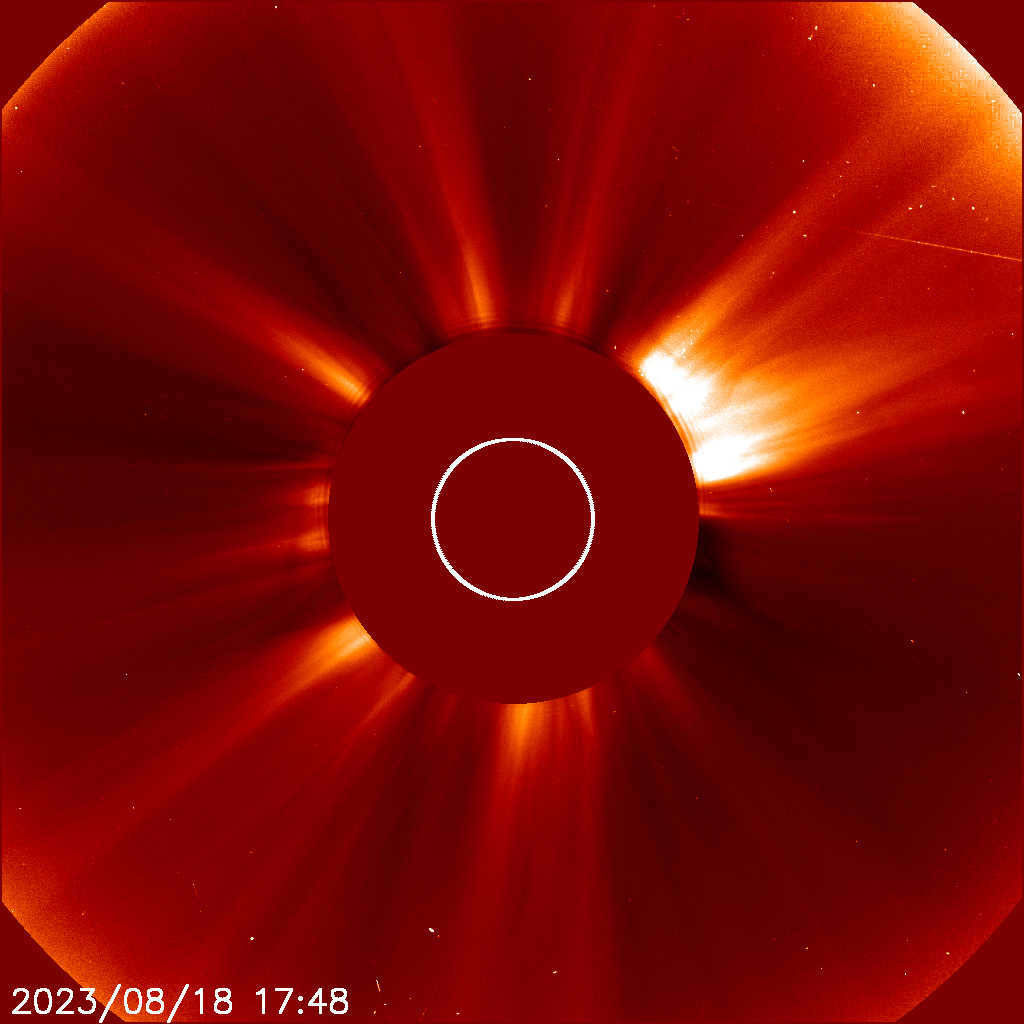
The SOHO satellite is equipped with a spectrometric coronagraph that can capture images of the solar corona by blocking direct light from the Sun and creating an artificial eclipse within the instrument itself. The position of the Sun’s disk is indicated by a white circle. One of the most notable features of the corona is the presence of coronal rays, which appear as radial streaks in the images. Additionally, a coronagraph can also capture events like coronal mass ejections.
Online access to the SOHO satellite image of the solar wind
SOHO instruments
One of the primary instruments aboard the satellite is the EIT, which stands for the Extreme Ultraviolet Imaging Telescope. This instrument captures images of the Sun’s atmosphere using wavelengths of 171, 195, 284, and 304 angstroms. In the image taken at 304 angstroms, the bright areas correspond to temperatures ranging from 60,000 to 80,000 Kelvin. The 171 wavelength corresponds to a temperature of 1 million degrees, while the 195 wavelength captures regions with a temperature of 1.5 million degrees. The 284 wavelength is indicative of a temperature of 2 million degrees Kelvin.
Another instrument on board the SOHO satellite is the MDI (Michelson Doppler Imager) instrument, which measures Doppler displacement. It operates at a wavelength of 6768 angstroms, making it particularly useful for observing Sunspots.
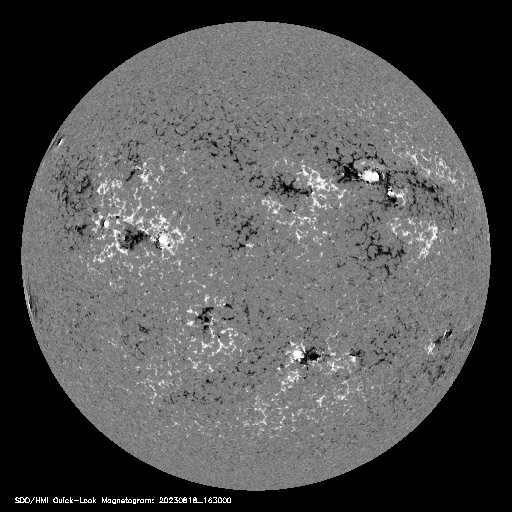
The photographs displayed on this page were captured at approximately 6768 angstroms using the SDO “peer” satellite. The focal points of interest in the image are the blemishes.
I am excited to present to you a compact yet practical undertaking that I created during my free time – the SunCalc solar calculator.
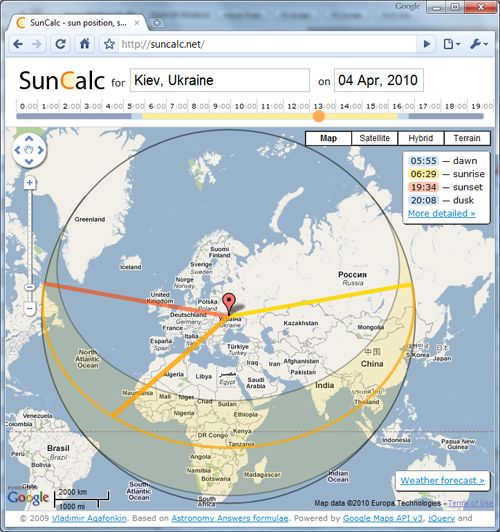
SunCalc displays the path of the sun and the amount of light throughout the day for the chosen location and date on a map. It also offers a few other useful features.
This idea came to me when I was searching for a picturesque spot in Crimea to capture the sun setting over the sea for a music video. I realized that all the existing tools were outdated, so I decided to create my own. I wanted it to be the best tool of its kind, so I researched numerous astronomical formulas and dedicated my free time to developing it. The result is SunCalc.
Unique Features
- Generates a visually stunning vector chart on the map displaying the sun’s position during sunrise, sunset, and at any specific time chosen (represented by yellow, orange, and red lines). Additionally, it showcases the sun’s trajectory projection (in the form of an orange arc) and its dispersion throughout the year (indicated by a yellow area surrounding it). The closer a point on the chart is to the center of the circle, the higher the sun is positioned above the horizon at that particular moment.
- Upon hovering over the sunset/dawn line, the corresponding range of positions is conveniently displayed.
- Provides a visual representation of illumination levels (ranging from darkness to twilight to daylight) through color-coded indicators on the time slider.
- Enables users to access not only the times of dawn and dusk, but also three different types of twilight (civil, navigational, and astronomical), as well as complete darkness.
- Includes a direct link to the weekly weather forecast (featuring cloudiness, precipitation, and fog) for the selected location.
- Find my current location (click on the corresponding field -> Find my location)
- You can also choose a location by searching, auto-detect, clicking on the map or dragging and dropping a marker.
- Permalinks to a specific location/time and back/forward in the browser are functional.
Practical uses for this tool
Firstly, it can be used in everyday situations. For example, determining how long I can stay in the woods before it gets too dark to see without a bike headlight. Or figuring out the latest time I can sunbathe on the beach before the cliff’s shadow covers it. Or finding out when the sun will no longer shine directly in my eyes while playing soccer on the nearby playground. It has already proven useful for answering these types of questions multiple times.
Additionally, people seek knowledge for the sake of their education and to fulfill their innate curiosity. For instance, they may wonder why Australia experiences hotter temperatures in winter compared to summer. They may also be intrigued by the phenomenon of white nights and want to know which cities and when they occur. Furthermore, they may be curious about polar day and night and how the sun’s path shifts from north to south. They might even ponder the duration it takes for dawn to break from Moscow to Kiev. These are just a few examples of the countless questions that drive people’s thirst for knowledge and understanding.
A few details of implementation
- All application code is executed on the client-side
- The map and search functionality is powered by Google Maps API v3
- The library Raphael is utilized for displaying vector graphics on the map
- Location data is obtained through the W3C Geolocation API, Google Gears, or Google IP Geolocation
- jQuery and several jQuery UI components are employed, with Slider for time selection, Datepicker for date selection, and Dialog for the welcome box
- Deep linking and ajax history are handled by the jQuery Address plugin
- The state is saved in cookies for persistence between sessions
- Surprisingly, Wolfram Alpha proved to be the most suitable choice for weather forecasting
- We have a page on the UserIdea/Reformal service for gathering ideas and suggestions on how to improve the application, which has already been covered by its authors on Hubre
What are the plans for the future?
- Create a mobile version for iPhone and Android browsers
- Implement an option to display time in the local time zone
- Add a slider for the days of the year, similar to the time slider
- Organize and publish the computational part of the code on GitHub
- Write an informative article for Hubra about the intricacies of developing such an application
I hope you find this small service useful. I would greatly appreciate your feedback and comments. Feel free to share your ideas or vote for existing ones here. Thank you!
Update: Apologies for the issues with hosting, the project has temporarily moved to a different server – everything seems to be running smoothly now.
Typically, there are two to four solar and lunar eclipses that occur each year on the calendar. In the year 2024, there will be eclipses of the Moon and the Sun expected during the spring season, followed by another “eclipse corridor” in the autumn. The publication “Izvestia” provides information on the specific dates and locations where these astronomical events can be observed.
The initial lunar eclipse of 2024 is set to take place on March 25th. Subsequently, the moon will be partially concealed on September 18th. On the other hand, the first solar eclipse of 2024 is predicted to occur on April 8th. The second celestial phenomenon is anticipated on October 2nd.
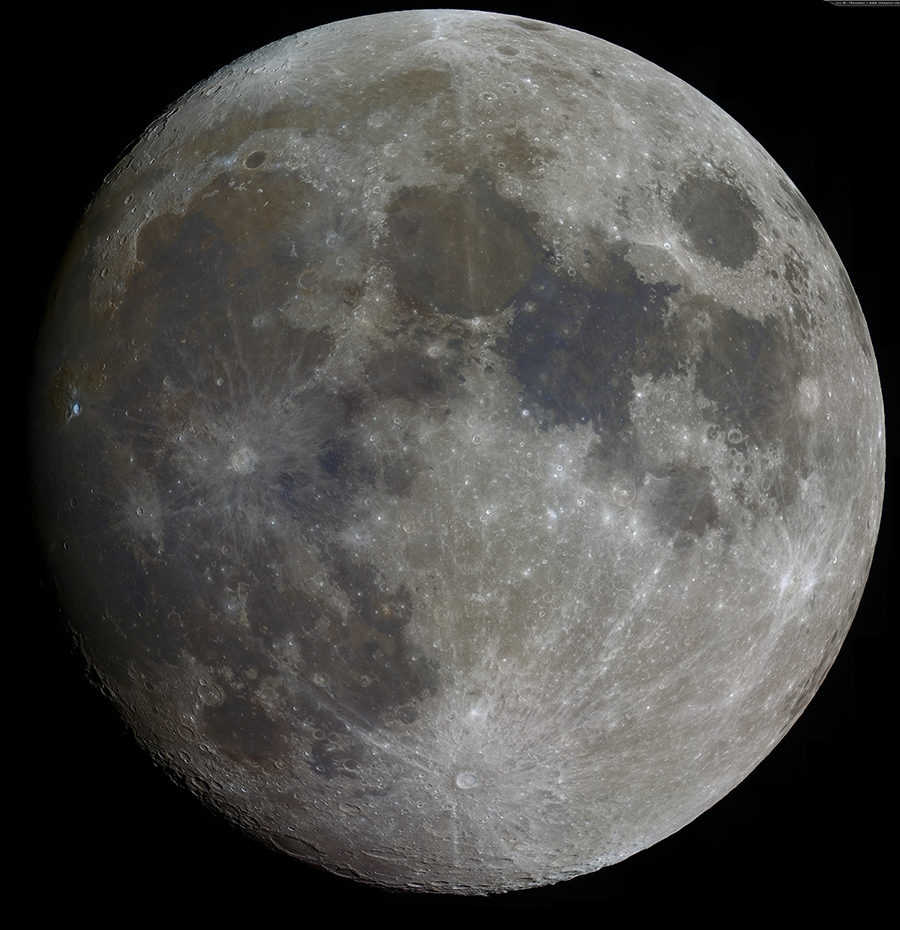
Lunar eclipse on March 25, 2024.
Astronomers classify the spring lunar eclipse as a penumbral lunar eclipse. This implies that the moon will be immersed in the Earth’s penumbra. In this scenario, the moon will be obscured by 95.57%, and it will be observable to the naked eye.

People living in Western Europe, Northeast Asia, Australia, a large part of Africa, North America, South America, the Pacific Ocean, the Atlantic Ocean, the Arctic Ocean, and Antarctica will have the opportunity to witness this amazing event. Unfortunately, the eclipse will not be visible from Russia.
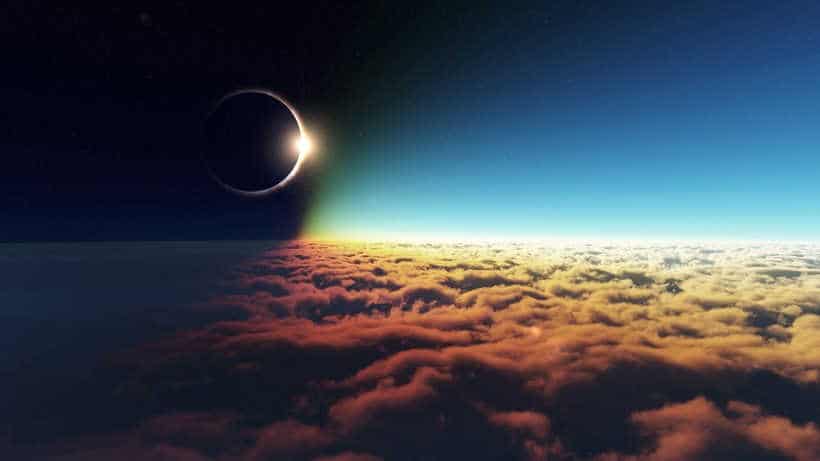
Solar eclipse on April 8, 2024.
On April 8, 2024, an extraordinary event is set to take place – a total solar eclipse. During this phenomenon, the Moon will align perfectly between the Sun and the Earth, resulting in a breathtaking sight as the daylight is momentarily obscured. Lasting for an impressive 4 minutes and 28.13 seconds, this eclipse promises to be an unforgettable experience. The prime locations to witness this celestial spectacle will be in Mexico, the USA, and Canada, where lucky residents will have the best view. However, residents in the western regions of Europe and Central America will also be treated to a partial eclipse, ensuring that even more people will have the opportunity to marvel at this natural wonder.
The September lunar eclipse is classified as a partial eclipse, indicating that the moon will only be partially in the Earth’s shadow.
This celestial event will be observable from various regions including the USA, Australia, East Asia, western Europe, and Africa.
Solar eclipse occurring on October 2, 2024
In October 2024, individuals on Earth will be able to witness an annular solar eclipse. During this phenomenon, the Moon will align with our planet and the Sun, yet it will be positioned at a distance that prevents it from fully obstructing the Sun’s rays.
The October eclipse will last for 7 minutes and 25 seconds. The annular shape of the Sun will be visible from Argentina, Chile, and the central and southeastern regions of the Pacific Ocean. People in southern regions of South America and adjacent waters will be able to observe the partial phases of the eclipse.
Things to Avoid During a Solar Eclipse
Believers in astrology firmly believe that solar eclipses can have an impact on one’s emotions and destiny. According to this belief, it is considered inauspicious to initiate any new endeavors during a solar eclipse as it may lead to a change in fortune. Astrologically speaking, this is not an ideal time for making deals, launching new projects, or altering one’s image. Additionally, it is advisable to limit interactions with others, opting instead for solitude and engaging in meditation and spiritual practices.