The Hertzsprung-Russell diagram. (also known as the Hertzsprung-Russell diagram, Russell diagram, G-R diagram, or color-stellar magnitude diagram) illustrates the correlation between the absolute magnitude, luminosity, spectral class, and surface temperature of a star. It is fascinating to note that the stars on this diagram are not randomly distributed but instead form distinct regions.
Independently proposed in 1910 by Einer Herzsprung from Denmark and Henry Russell from the USA, this diagram is utilized for star classification and aligns with contemporary understanding of stellar evolution.
The diagram provides a means (albeit not very precise) of determining the absolute magnitude based on the spectral class, particularly for spectral classes O to F. However, for the later classes, the distinction between giant and dwarf stars complicates matters. Nevertheless, certain variations in the intensity of specific lines enable us to make this distinction with confidence. [1]
Approximately 90% of stars fall into the main sequence category, where their luminosity is a result of nuclear reactions that convert hydrogen into helium. Additionally, there are various branches of pre-evolved stars, such as giants, where helium and heavier elements undergo fusion. The lower left section of the diagram represents fully pre-evolved white dwarfs.
Different Types of Diagrams
The classification of diagrams is not very precise, and there are several different types. Initially, the diagram represented the spectral class of a star on the x-axis and the absolute stellar magnitude on the y-axis. However, displaying the spectral type on the diagram proved to be challenging, as it is not a numerical value. In modern versions of the diagram, I will present the color index of B-V stars. This particular type of diagram is commonly referred to as the Hertzsprung-Russell diagram or the color-stellar magnitude diagram, and it is frequently used by observers. In cases where stars are at similar distances (such as in star clusters), the diagram is often utilized to describe the cluster, and the y-axis is simply the stellar magnitude.
Related Content
Important Points
The correlation between the absolute magnitudes of stars and their spectral classes was independently organized by two researchers, Einar Hertzsprung from Denmark and Henry Norton Russell from the United States. In 1905, Hertzsprung published his initial scientific article, where he constructed a diagram showcasing the relationship between color and luminosity, and placed all known stars on the graph. Despite being published in a German journal, the Herzsprung diagram went unnoticed by the scientific community. Russell, on the other hand, developed his own theory in 1909, which became widely known as the spectrum-luminosity diagram. It was not until the 1930s that the scientific community recognized the contributions of Hertzsprung and gave him the recognition he deserved.
Understanding the Hertzsprung-Russell Diagram Main Sequence
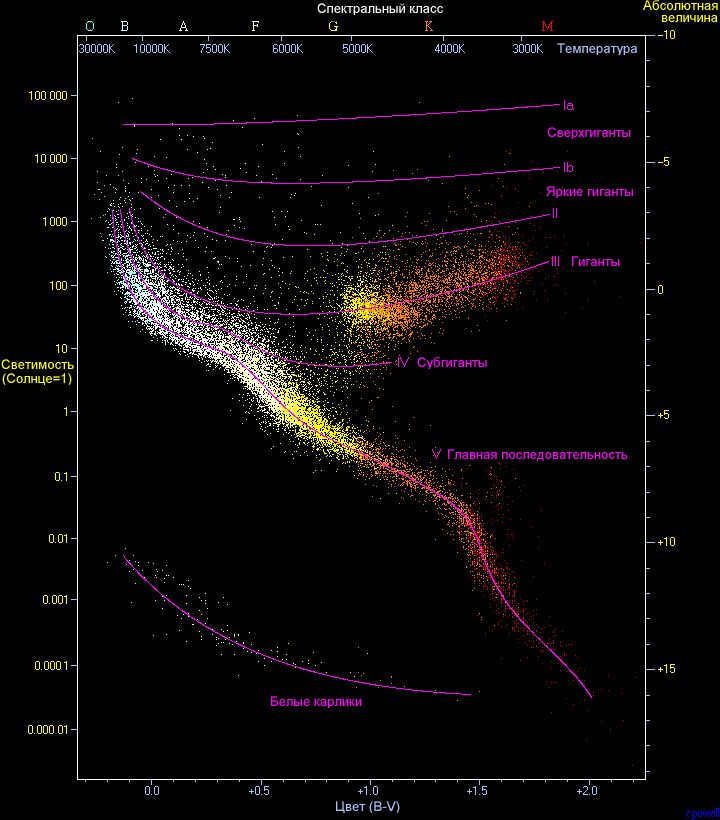
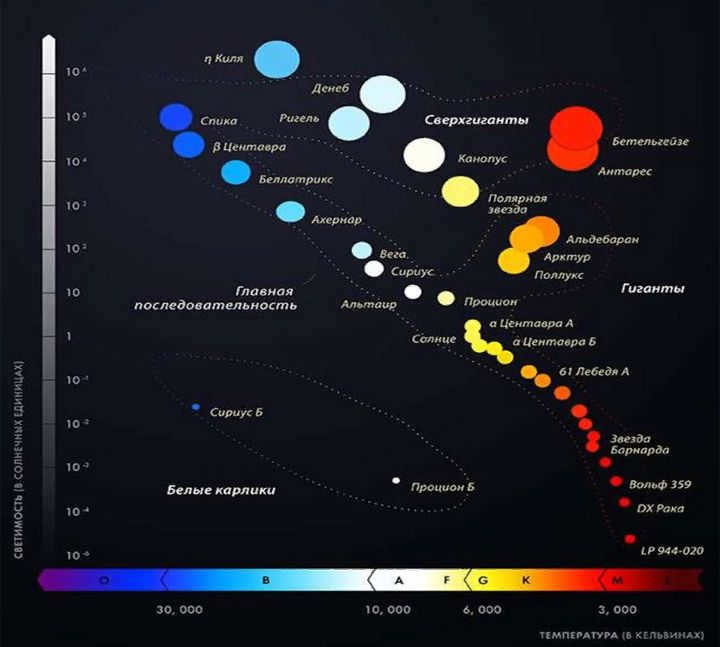
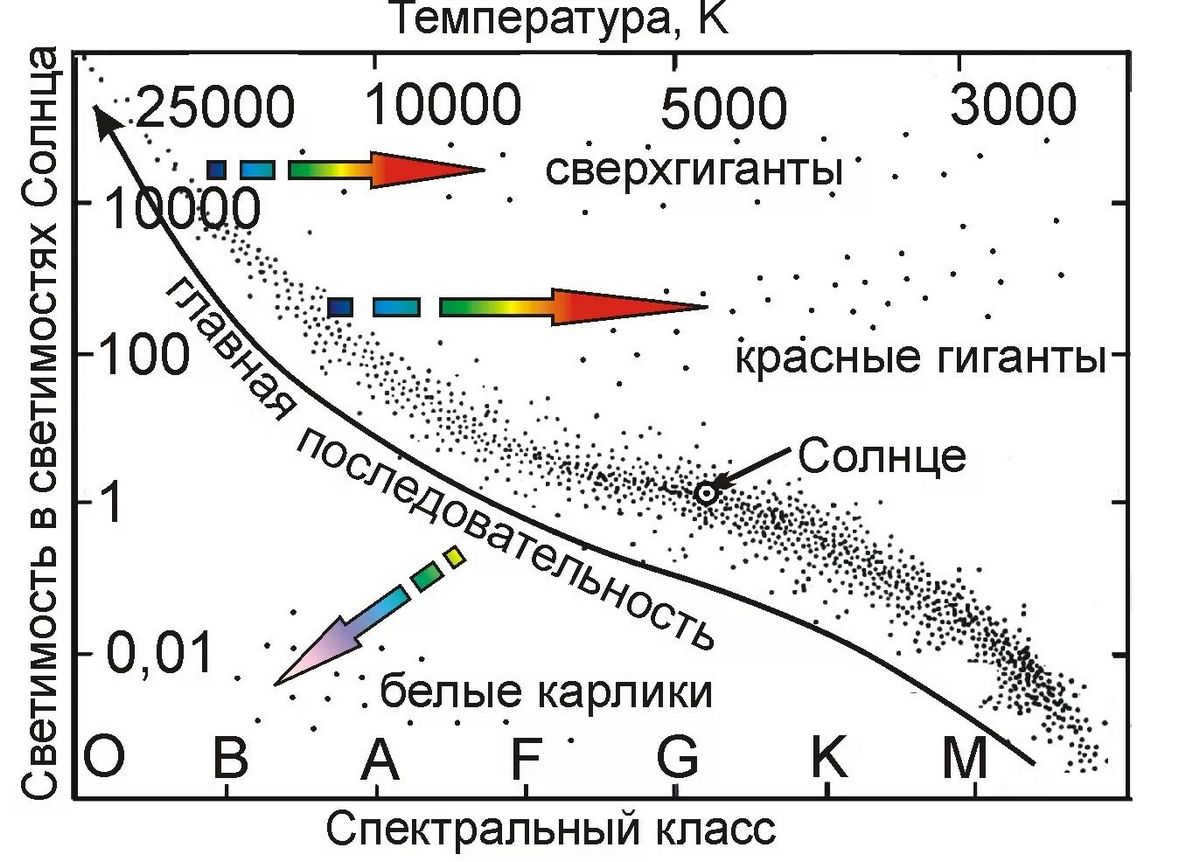
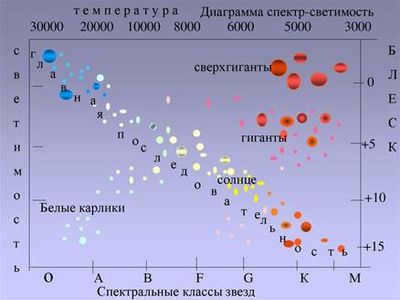
The Hertzsprung diagram arranges absolute stellar magnitudes in ascending order along the vertical axis. The horizontal axis displays spectral classes in descending order of temperature. Typically, stars with higher temperatures exhibit greater luminosity, positioning them in the top left region of the diagram. Conversely, colder stars tend to have lower luminosity and are represented in the lower right corner. The majority of known stars, approximately 90%, fall within the diagonal span between the upper left and lower right corners. This group of stars is commonly referred to as the “main sequence of the Hertzsprung-Russell diagram”.
Separate groupings of stars appeared on the diagram, albeit in small quantities. Clusters of short-lived giants and supergiants were positioned above the main sequence, while long-lived dwarf stars were situated below. The main sequence encompasses stars that are currently in the primary phase of their development. The table provides an outline of the key features associated with the stellar sequences.
| Parameters | Main Sequence stars | White dwarfs | Giants and supergiants |
| Size, R☉ (in solar radii) | 0.12-16 | 0.01-0.001 | 10-1000 |
| Spectral class | O-M | B-K | F-M |
| Luminosity, L | 10^-4 -10^6 | 0.01-0.1 | 10^5 -10^6 |
| Lifespan, years | ~10 billion | ~10^15 | ~100 million |
| Temperature, °K | 3000-50000 | 3500-30000 | 3000-20000 |
The Concept of Sliding Evolution in Stars
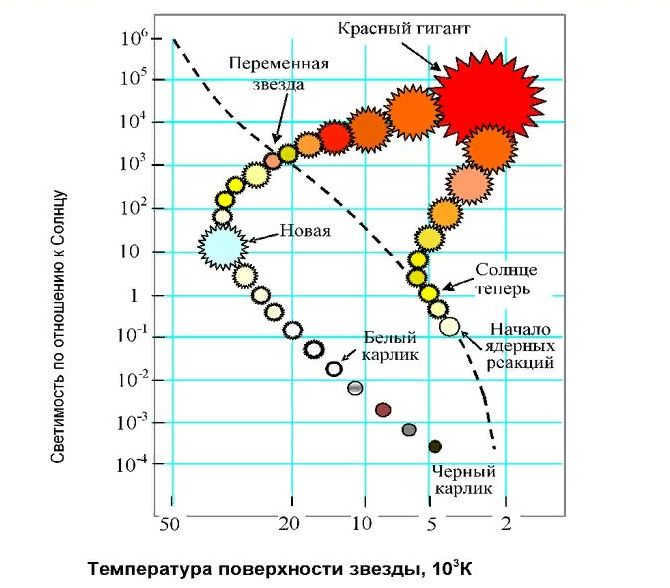
During the early 20th century, scientists held the belief that all stars undergo a process of contraction as they evolve. Russell put forth a theory of stellar evolution based on his diagram, outlining the following stages:
- The initial gas-dust cloud experiences compression due to rotation, leading to an increase in temperature.
- The resulting center of the nebula forms a massive object that emits infrared radiation.
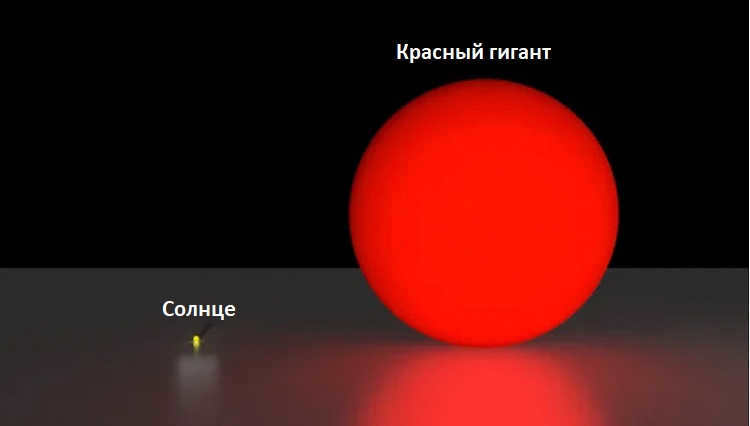
- As pressure continues to build, the star’s temperature rises to the point where it becomes a red giant, visible in the red spectrum.
- Further compression causes the object’s temperature to increase even more, shifting it to the yellow, white, and blue spectrum. In the Hertzsprung-Russell diagram, this evolving star moves towards the left and upwards.
- Heating ceases inexplicably at the blue star stage (this is a vulnerability in the theory, as no satisfactory explanation for this phenomenon has been discovered), while the compression process persists.
- During subsequent stages, the star contracts in size and transitions from the blue spectrum to the red spectrum, transforming into a red dwarf. On the diagram, the position of such an object will shift downwards and to the right from the upper left corner.
- Once a star has depleted its energy, it extinguishes, leaving behind a black dwarf.
The previously stated concept has been referred to as the “Theory of Stellar Evolution through Travel”. This proposition appeared credible, as some of its assumptions were verified through experimentation, although it failed to address all inquiries. As scientific knowledge advanced, the Hertzsprung diagram was enhanced with the inclusion of additional stars and their respective sequences, thereby enabling the refinement of Russell’s theory.
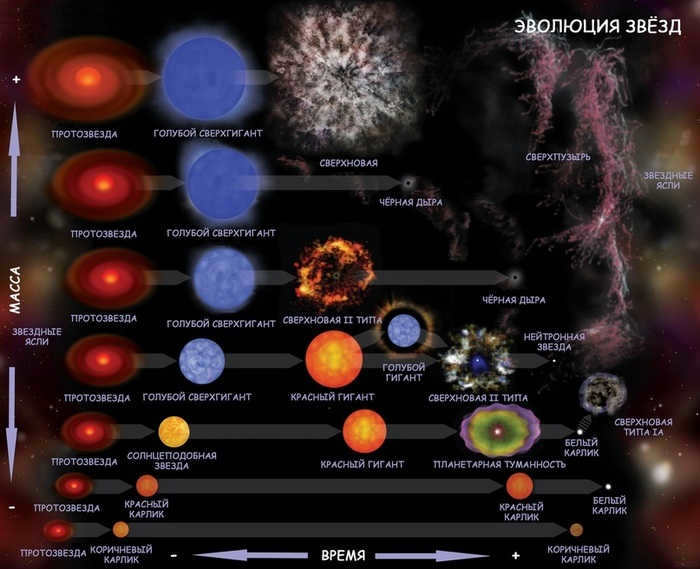
According to modern scientific understanding, stars are formed when a cold gas cloud collapses under the force of gravity. This collapse releases heat, causing the gas cloud to heat up. Once the temperature reaches a few million Kelvin, a thermonuclear reaction ignites, marking the birth of a star. The main class of stars where hydrogen is converted into helium is known as the main sequence. The future evolution of a new celestial object is estimated based on its initial mass:
- Protostars, which have masses several times greater than that of the Sun, undergo a contraction process to become hot O- and B-class stars. These stellar objects are characterized by their brightness, high temperature, and large size. The larger the star, the faster the hydrogen fuel is consumed, leading to the next stage of evolution – the giant (supergiant) phase. During this phase, thermonuclear reactions involving helium take place. As the helium is completely transformed into carbon, the star expands and sheds its outer layers. What remains is the core, which can either turn into a neutron star or collapse into a black hole.
- Protostars, which have a mass similar to that of the Sun, evolve into stars that belong to the main sequence stage. The lifespan of these stars is approximately 10 billion years. Eventually, these stars progress to the red giant phase on the Hertzsprung-Russell diagram. This phase accounts for about 10% of the star’s lifetime and concludes with the shedding of its outer layers, resulting in the formation of a white dwarf.
- Protostars, which have masses that are several times smaller than that of the Sun, have the ability to form into red dwarfs. These stars have a moderate flow of thermonuclear reactions due to their low temperatures, allowing them to exist for an incredibly long time – ranging from tens of billions to tens of trillions of years. Since there is no helium present, they are unable to transform into red giants. As time goes on, the red dwarf star burns out and gradually shrinks, resulting in an increase in temperature. Eventually, it transforms into a blue dwarf and then into a white dwarf.
- A protostar with a mass less than 0.08 solar masses is unable to become a star. The mass and pressure of such an object are too low to trigger thermonuclear reactions, causing it to only radiate in the infrared. These “failed” stars are similar to the giant planets in our solar system.
As our galaxy continues to age, the main sequence will become less abundant, while the number of dwarfs will increase.
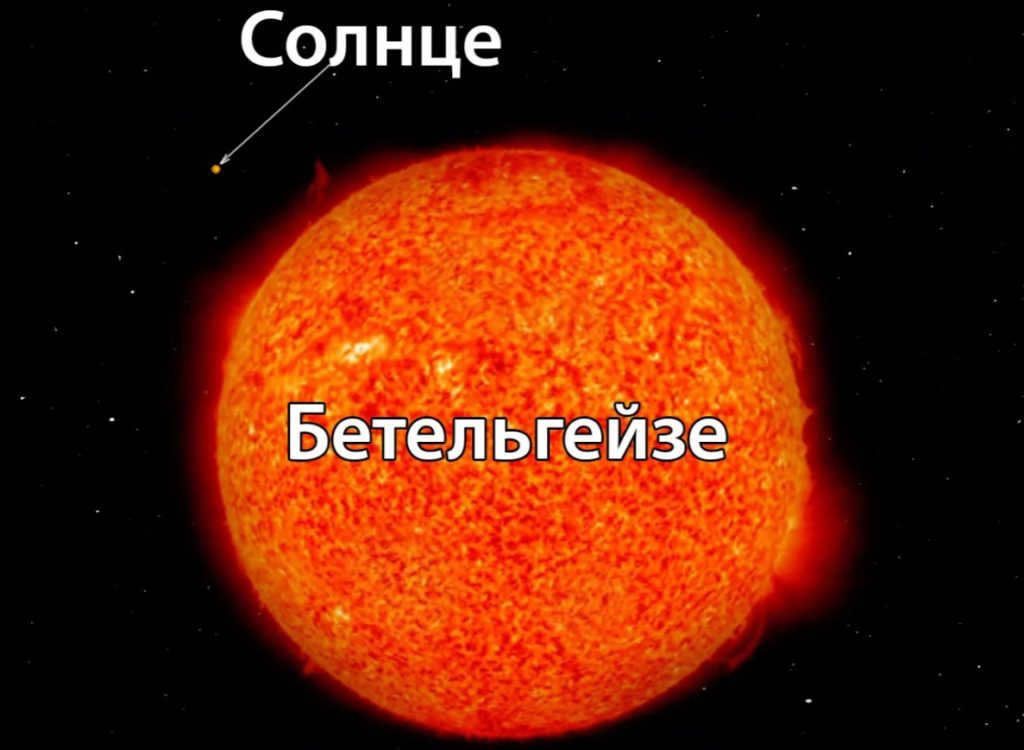
According to the Hertzsprung-Russell diagram, the star’s low temperature and weak luminosity are indicated by its red emission spectrum. The spectral emission lines of red stars reveal a surface temperature of approximately 36000 K, which is 400 times lower than the Sun’s surface temperature. Barnard’s star is an example of such faint objects. However, there are also red stars, like Betelgeuse, that have brightness and luminosity thousands of times greater than the Sun’s. Hertzsprung proposed that these deviations from the main sequence of the diagram could be accounted for by the varying sizes of stars within the red spectrum.
This hypothesis was put to the test using the Michelson interferometer. By employing this apparatus, it becomes feasible to determine the angle between the beams emanating from different points on the surface of the celestial body. By utilizing a specialized equation that factors in the angle and the distance to the star, its dimensions can be ascertained. The calculations have revealed that Betelgeuse’s diameter is 350 times greater than that of the Sun, and its volume is 40,000,000 times greater. If positioned in the Sun’s place, such a star would engulf all of the planets within the Earth’s orbit. These entities have acquired the designation of red giants.
Red dwarfs are known as small stars in the red spectrum. These celestial bodies are widespread throughout the Universe, particularly in ancient clusters and in the unseen regions. Due to their low luminosity, they are challenging to detect and study. Red dwarfs mark the end of the main sequence. Their lifespan is incredibly long, and the stable conditions on planets orbiting them suggest the potential for the development of life.
Interestingly, there are no red spectrum objects of intermediate sizes. The Hertzsprung diagram exclusively includes red dwarfs and red giants.
Red supergiants and infrared supergiants
As red supergiants undergo degeneration, their emission spectrum can transition to the infrared spectrum, which is not visible to the human eye. Red supergiants and infrared supergiants can be found on the diagram above the main sequence towards the right. There exist colossal entities in the cosmos that are incredibly cold, to the point where their immense dimensions render them undetectable.
One instance of this phenomenon can be observed in the double star known as Epsilon of Ascendant. During the 19th century, astronomers made the fascinating discovery that this celestial object experiences periodic dimming, followed by a restoration of its luminosity. More recent studies have revealed that Epsilon of Ascendant is actually a binary star system, in which one star periodically outshines the other. The first star is a bright F-class star, categorized as a white supergiant and boasting a diameter that is 190 times larger than that of the Sun. The second star, on the other hand, belongs to the spectral class B and has a radius that is 2700 times greater than that of the Sun. Despite its immense size, this star is not visible to the naked eye. This is due to its low surface temperature of 16000 K, which causes it to emit radiation in the infrared spectrum.
Research into the vast expanse of the cosmos has revealed that the presence of infrared objects is not uncommon. Thanks to advanced technology, scientists are now able to investigate cold spectrum emitters such as brown dwarfs, young heating stars, intergalactic dust, residual radiation from celestial remnants, and even expand the catalogue of known galaxies. An astonishing discovery was made using the specialized Spitzer telescope, which unveiled a rare system comprised of four infrared galaxies.
Do you believe that modern science has unraveled all the secrets of stellar evolution? Or do you think there are still more groundbreaking discoveries waiting to be made?
Later on, it was discovered that an American Henry Norton Russell had also created a nearly identical diagram, albeit a bit later.
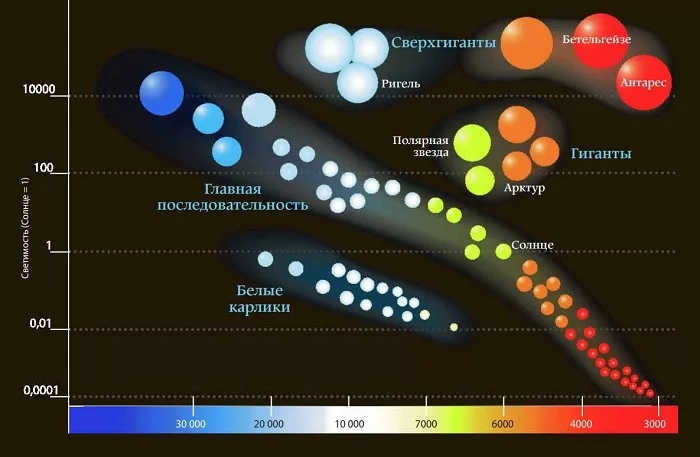
The appearance of the Hertzsprung-Russell diagram can be visualized in this manner. Our Sun is situated precisely at the midpoint of the main sequence – signifying that it is currently in its prime stage of existence.
What is the primary sequence of the Hertzsprung-Russell diagram?
The diagram known as the Hertzsprung-Russell diagram, or the spectrum-luminosity diagram, was discovered by two astronomers.
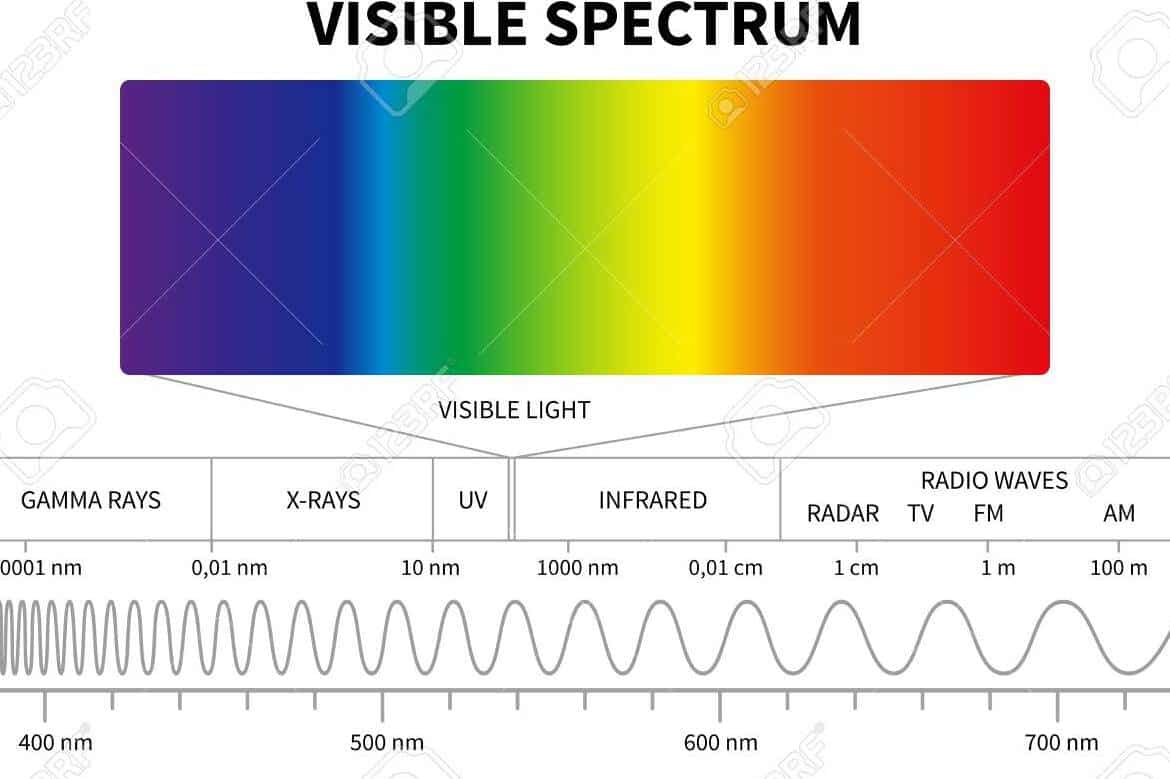
The Hertzsprung-Russell diagram plots the spectral classes on the horizontal axis in order of decreasing star temperatures. The spectral classes begin with class O (very hot stars) on the left and end with class M (relatively cool stars) on the right.
The vertical axis represents the luminosities or absolute stellar magnitudes. Each star has a specific absolute magnitude and belongs to a specific spectral class, which is represented by a point on the diagram.
On average, the brighter a star is, the hotter it tends to be. This means that the further to the left on the diagram the star’s spectral class was (indicating a higher temperature), the higher it appeared on the absolute magnitude scale.
Consequently, the majority of stars plotted on the diagram by Ressel were arranged diagonally from the top left corner to the bottom right corner. These stars make up what is known as the main sequence.
According to current estimates, over 90% of all stars that we have access to fall within the main sequence.
You might also be interested in
The situation with red stars (which will be discussed in more detail below) is more complex – it is not always possible to immediately distinguish between a giant and a dwarf, but with experience, there should be no mistakes.
The theory of stellar evolution
When the Hertzsprung-Russell diagram was first created, our understanding of nuclear reactions within stars was still limited. The prevailing belief was that stars were continuously contracting throughout their lifetimes.
From this perspective, the Hertzsprung-Russell diagram provided a clear and fascinating depiction of stellar evolution, illustrating how stars form, progress through various stages, and eventually cease to emit radiation.
Russell’s conclusions from this diagram can be summarized as follows:
- Initially, a star begins as a gathering of frigid gas that gradually contracts.
- During this contraction, the star becomes hotter and primarily emits radiation in the infrared portion of the electromagnetic spectrum – it transforms into an infrared giant similar to Epsilon of Ascendant.
- As the contraction progresses, the star becomes hotter and starts emitting bright red light, similar to Betelgeuse and Antares.
- The star continues to contract and heat up, evolving into a yellow giant, which is smaller but hotter than the red giant, and eventually transforms into a bluish-white star, which is even smaller and hotter.
- The O-class star, with its bluish-white color, is only slightly bigger than the Sun but much hotter, with a surface temperature of 30,000°C, which is five times higher than the Sun’s. Its peak radiation is in the blue-violet and ultraviolet regions, giving it its distinctive color.
- As the star progresses from the cold nebula stage to the bluish-white stage, it moves from right to left in the upper portion of the Hertzsprung-Russell diagram until it reaches the upper left corner of the main sequence.
- The star is currently undergoing contraction due to gravity, but it no longer experiences heating for an unknown reason. One possible explanation for this phenomenon is that during the bluish-white star stage, its matter becomes so dense that it loses its gaseous properties. As the star continues to contract, more and more of its core transitions from gas to a different state, resulting in a proportional reduction in heat release.
Consequently, the bluish-white star simultaneously shrinks and cools, progressively weakening due to the combined effects of these factors. It eventually transforms into a yellow dwarf, similar to our Sun, then further evolves into a red dwarf like Barnard’s star, and ultimately extinguishes completely to become a black dwarf – the remnants of a burnt-out star.
This is a representation of the evolution of a “typical” star on the Hertzsprung-Russell diagram.
As per this hypothesis, the star undergoes a gradual transformation from a bluish-white star to its final stage as a black dwarf, moving along the main sequence from the upper left corner to the lower right. Hence, this theory can be referred to as the “gliding stellar evolution” theory.
The concept appeared highly attractive and appeared to be quite plausible.
Furthermore, if the same celestial body was once a red giant in its early stages and later transformed into a red dwarf, it would be reasonable to assume that the average mass of red dwarf stars is not significantly different from that of red giants. In simple terms, the immense size of red giants is not due to an abundance of stellar matter, but rather because their matter is spread out over a vast volume.
And this hypothesis has proven to be true. Red giants are not as massive as one might expect based on their size, but rather they are quite diffuse. If it were possible to transport the matter of a star like Epsilon of Ascendant to a laboratory on Earth without any alterations, most of its volume would appear to contain virtually nothing.
Undoubtedly, the average masses of stars exhibit remarkable similarity. Despite variations in volume, density, temperature, and other characteristics, their masses show minimal divergence. The majority of stars have masses ranging from 0.2 to 5 times that of the Sun.
Nevertheless, the elegant theory of stellar evolution through sliding fails to account for certain aspects. More precisely, it encompasses a few exceedingly exceptional anomalies.
Exceptions to the primary sequence of the Hertzsprung-Russell diagram: red giants and red dwarfs.
After acquiring data on the brightness and surface temperature of multiple stars, the subsequent logical progression was to analyze and compare this information. Experiments conducted with heated objects on our planet indicated that stars with lower temperatures would emit weaker radiation and exhibit a redder hue. However, it was discovered that this correlation does not consistently hold true.
For instance, assuming we concur with the temperature values acknowledged for spectral categories, the chilliest of typical stars ought to be stars of the M classification. Based on their spectral lines and the location of the emission peak, the average surface temperature for stars in this category was evaluated to be 2500°C (let’s remember that the surface temperature of our Sun is 6000°C). In fact, all M-class stars had a reddish hue, contrary to what was anticipated, they were not universally dim.
When E. Herzsprung pondered this question back in 1905, he reached the conclusion that the immense luminosity of a cold star could only be accounted for by its enormous size. While the surface of a cold star emits far less light per square kilometer compared to the Sun, a star like Betelgeuse could potentially have a significantly larger surface area in square kilometers.
This would more than make up for the relatively low brightness of each individual square kilometer. Hence, stars such as Betelgeuse and Antares came to be known as red giants, while stars like Barnard’s star were classified as red dwarfs.
This finding was particularly intriguing because there appeared to be no existence of intermediate red stars that were neither giants nor dwarfs.
This hypothesis from Herzsprung, which was supported by observations, was validated. In 1881, Albert Abraham Michelson, a German-born American physicist (1852-1931), created an instrument known as the interferometer.
This instrument, capable of detecting even the slightest alterations in the amplification and attenuation patterns of light waves, enabled highly precise measurements to be made. It provided insights into celestial bodies that would otherwise remain undetectable by telescopes.
Although the closest stars are located at great distances from us, even the most advanced telescopes can only observe them as tiny, luminous dots. However, it is important to note that the rays emitted by a star do not originate from a single point on its surface. Instead, some rays may come from the star’s western edge, while others may come from its eastern edge. These rays enter the telescope at various angles, which are typically too small to be measured using conventional methods. However, in certain cases, these angles may be large enough for the rays to “collide” and combine with each other.
Thanks to Michelson’s instrument, it became possible to measure the resulting combination of rays and determine the angle between them, unless it was negligible. By knowing this angle and the distance to the star, it would be relatively easy to calculate its actual diameter.
The findings were astonishing. In 1920, scientists used this method to measure the diameter of Betelgeuse and discovered that it spans a distance of 500,000,000,000 kilometers. This is nearly 350 times larger than the diameter of the Sun, which measures 1,390,600 km. As a result, the surface area of Betelgeuse is approximately 350 times 350, or 120,000 times greater than that of the Sun. It comes as no surprise, then, that the luminosity of this star is much higher than that of the Sun, even though the luminosity per square kilometer of its surface is much lower.
In terms of volume, Betelgeuse is about 40,000,000 times larger than the Sun. If Betelgeuse were positioned in the Sun’s location, it would completely fill the space well beyond the orbit of Mars. It is indeed a remarkable red giant!
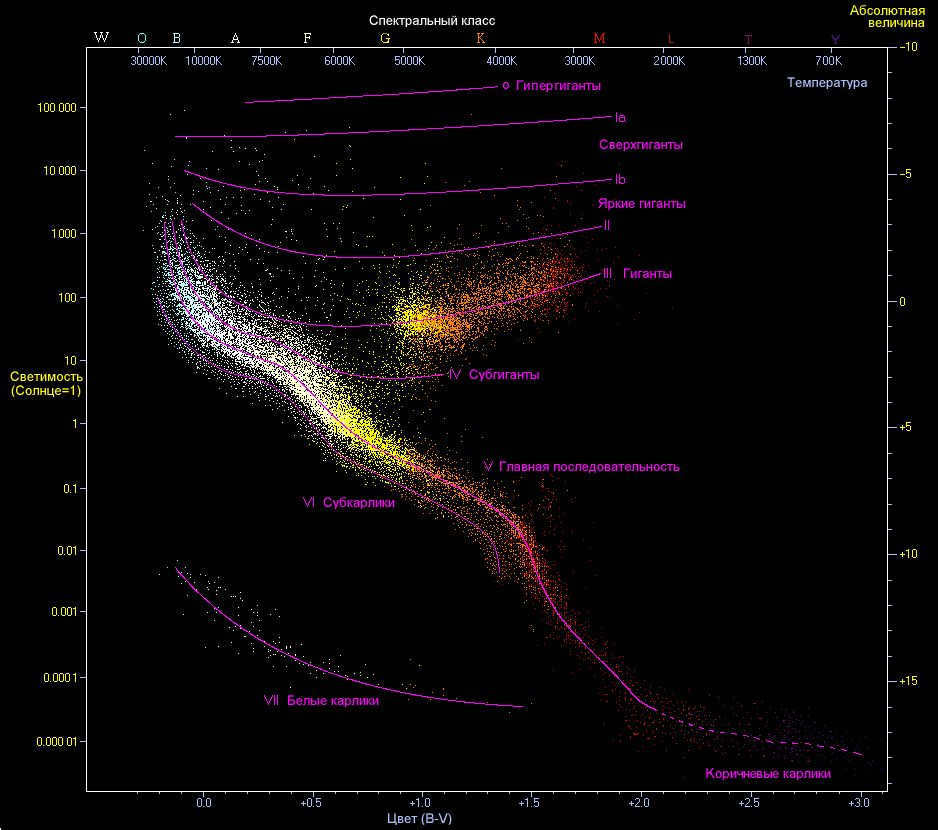
Once again, we have the Hertzsprung-Russell diagram in the previous image, but this time without the distracting colors and labels.
Red giants and… infrared giants
Antares is slightly smaller compared to Betelgeuse, but Betelgeuse is not the largest star of this kind. An example of a larger star is Epsilon of Ascendant – an infrared giant. This star is so cold that despite its enormous size, it remains invisible to us. Its radiation is predominantly in the infrared. We only know about its existence because it has a bright companion that it occasionally passes in front of, causing periodic eclipses.
Infrared giants are more common than initially thought. However, detecting a star that emits predominantly infrared radiation is extremely challenging.
There are two main reasons for this difficulty. Firstly, the Earth’s atmosphere has limited transparency to infrared rays. Secondly, all objects on Earth emit their own infrared radiation due to their warmth. As a result, the infrared radiation from outer space gets lost amidst the overall glow.
However, astronomers at the Mount Wilson Observatory developed a unique method in 1965 to search the sky for regions abundant in infrared radiation, which signifies the presence of infrared giants. They have discovered numerous objects of this kind, mainly concentrated in the Milky Way’s plane. However, there is the potential to discover thousands more, and it is highly likely that some of them will be larger than Epsilon of Ascendant.
In the infrared spectrum, these objects are remarkably luminous. However, their emission in the visible part of the spectrum is extremely faint. As a result, only a few of them can be observed even with the most powerful telescopes. Two stars that have been detected have temperatures of 1200 and 800°K based on their color. The second star has just reached the temperature of red-hot.
Stars of different colors do not exhibit the same size disparity as cool red stars. However, there are sizable yellow giants (although not as massive and chilly as red giants) and smaller yellow dwarfs (though not as diminutive and cold as red giants). One example of a yellow giant is Capella, while our Sun serves as an example of a yellow dwarf.
To summarize, it is worth noting once again that red giants and dwarfs are an anomaly in the overall context of the Hertzsprung-Russell diagram, and their proportion compared to the “normal” stars that fall within the main sequence of the diagram is relatively small.
There is currently no alternative theory of stellar evolution that is as clear, straightforward, and universally accepted as the theory of rolling evolution derived from the information presented in the diagram. As a result, we must acknowledge and appreciate the brilliance of the astronomers who came before us and, of course, confidently utilize their advancements!
The Obuchonok website offers a collection of student research papers and projects, creative project topics and guidelines for their execution, as well as educational programs for children.
HTML code for banner:
Studies and undertakings on paper
Hertzsprung-Russell diagram
While conducting a research project on the topic of the “Hertzschrung-Russell diagram”, students of the 10th grade successfully accomplished their objective. They were able to familiarize themselves with the history behind the creation of the Hertzschrung-Russell diagram, construct the temperature-luminosity diagram, and establish the correlation between the various characteristics of stars.
Learn more about the project:
Within a personalized astronomy research project titled “Hertzsprung-Russell diagram,” students delved into the theoretical underpinnings of this diagram’s creation. By examining the historical context and the scientists’ contributions, students gained a deeper understanding of how to classify and categorize stars based on their physical attributes. Prior to creating a visual aid, students engaged in discussions with their physics teacher and conducted extensive research using reputable online sources.
In the completed children’s student project about the “Hertzsprung-Russell diagram,” 10th-grade students at the school explained the composition of the Hertzsprung-Russell diagram, investigated the correlation between the physical attributes of stars, and examined various groups of stars, which are categorized based on their physical attributes. Using the information gathered and their newfound knowledge, the students constructed the Hertzsprung-Russell diagram.
Introduction
1. A brief overview of the Hertzsprung-Russell diagram.
2. The structure and components of the Hertzsprung-Russell diagram.
3. Implementation and practical application of the Hertzsprung-Russell diagram.
4. Utilizing the Hertzsprung-Russell diagram in various scientific fields.
Conclusion
References
Appendix
Introduction
During our tenth-grade astronomy course, we were introduced to the fascinating subject of the Hertzsprung-Russell diagram. It became evident that a comprehensive understanding of this diagram was crucial for accurately answering questions in physics exams. To aid our learning and exam preparation, we decided to create a visual tool that would assist us not only in our astronomy lessons but also in our eleventh-grade exam.
Purpose of the work: The objective is to familiarize oneself with the history of the creation of the Hertzsprung-Russell diagram, construct a temperature-luminosity diagram, and establish connections between the characteristics of stars.
- To establish correlations among the physical properties of stars;
- To confirm the existence of different groups of stars, classified based on their physical attributes;
- To develop the ability to apply theoretical knowledge, including the laws of physics, in order to explain the observed patterns;
- To learn how to utilize acquired knowledge to solve problems in the Unified State Exam CMM physics section.
Proposal: By actively engaging in the study of the Hertzsprung-Russell diagram, we can enhance our ability to navigate and categorize stars into distinct groups, while also establishing a correlation between their physical attributes.
- Researching literature and other online resources
- Engaging in discussions with physics and astronomy instructors
- Analyzing and synthesizing acquired data
- Creating visual aids to aid comprehension
A brief overview of the Hertzsprung-Russell diagram’s historical background
In the year 1910, two renowned astronomers, Danish scientist Hertzsprung and American researcher Russell, independently and empirically established a correlation between the luminosity of stars and their spectral class.
Henry Norris Russell (1877-1957) was an esteemed astrophysicist from America. Born into a family of clergymen in Oyster Bay, New York State, he pursued his education at Princeton University, where he eventually became the successor of his mentor, Professor C. Russell held the positions of astronomy professor and observatory director at Princeton until 1947.
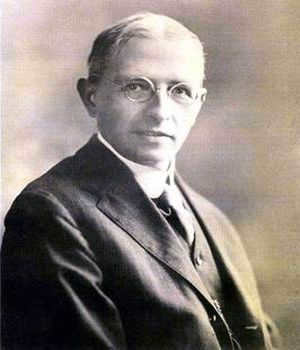
For a considerable period of time, Russell dedicated his research to exploring the correlation between the luminosity of stars and their spectra, aiming to gain insights into the evolution of celestial bodies. In 1913, independently from Herzsprung, he constructed a diagram that established a connection between the spectral characteristics and luminosity of stars, which is now widely known as the Herzsprung-Russell diagram. This diagram was based on the analysis of images captured by Russell on photographic plates at Princeton University’s observatory.
Regrettably, Russell drew an incorrect conclusion from the diagram, mistakenly assuming that stars first manifest themselves as red giants and eventually transform into white dwarfs.
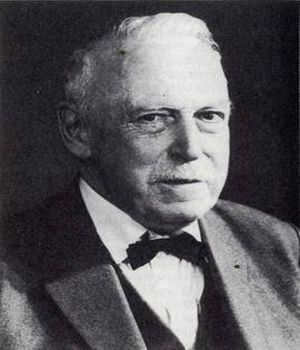
The director of the Potsdam Observatory, C. Schwarzschild, was impressed by his research, which led to an invitation for Herzsprung to join the University of Göttingen and later the Potsdam Observatory in 1909. In 1919, Herzsprung began working at the Leiden Observatory and eventually became its director in 1935. After retiring, he returned to Denmark and continued his research at the Brorfeld Observatory.
With his background as a photo chemist, Herzsprung developed a unique technology for that time period to calculate the luminosity of stars based on their photographic images. By comparing these results with data on the spectra of the stars, Herzsprung was able to create his classification system, which divides stars into giants, dwarfs, and main sequence.
Henry Norris Russell, who had been fascinated by the challenge of describing the life cycle of stars for many years, seemingly arrived at the fundamental concept of the diagram as early as 1909. However, the publication of his work did not occur until 1913. In a similar vein, Danish scientist Einar Herzsprung reached the same conclusions as Russell a few years prior, but his findings were initially published in a highly specialized German journal called “Journal of Scientific Photography” in 1905 and 1907, which went unnoticed by astronomers at the time.
As a result, until the mid-1930s, this chart was commonly referred to as “Russell’s diagram” until a mistake was discovered, leading to the recognition of the Danish scientist’s contribution. Now, the diagram is credited to both scientists. By plotting the positions of numerous stars on the diagram, with spectral classes of stars on the x-axis and luminosities on the y-axis, it becomes apparent that the stars are not randomly distributed but instead form distinct groups. A star’s position on the diagram is determined by factors such as its mass, age, and chemical composition.
The creation of the diagram was the outcome of one of the numerous logical experiments being conducted at that time. Norris Russell and Einar Hertzsprung simultaneously conceived the idea, what if stars were aligned in a single coordinate system where their position on the vertical axis was determined by their luminosity and on the horizontal axis by their temperature? If the stars were uniformly distributed throughout the system, there would be no discovery.
However, any deviation from the order would reveal a pattern in the arrangement of the stars that could explain many mysteries. And so it transpired. With the Y-axis representing luminosity increasing from bottom to top and the X-axis representing temperature increasing from right to left, the stars can be categorized into three distinct groups – sequences, as they are referred to by astrophysicists:
In the center, spanning from the top left to the bottom right, lies the primary sequence – a succession of regular, diminutive stars that constitute 90% of the stars in the cosmos. This encompasses our Sun. Their temperature is directly correlated to their luminosity – the more scorching the star, the more radiant it shines.
Clustered in the top right corner are celestial beings that are exceptionally brilliant, yet possess a low temperature – this is evidenced by their crimson hue. This group consists of giants and supergiants.
Beneath the primary sequence exist stars that reach blue and white hues, while emitting minimal light. These are referred to as white dwarfs.
The Hertzsprung-Russell diagram – The H-R diagram is a plot that shows the luminosity (brightness) of stars on the vertical axis and their surface temperature on the horizontal axis. These two variables can be measured experimentally, as long as the distance from the Earth to the star in question is known.
From a purely historical standpoint, the surface temperatures of stars are plotted on the horizontal x-axis in reverse order. This means that the hotter the star, the further to the left it is on the graph. It’s important to note that this convention is purely traditional and there is no need to debate or question it. The purpose of the Hertzschrung-Russell diagram is to include as many experimentally observed stars as possible, with each star represented by a corresponding point. By doing this, scientists can identify patterns and trends in the distribution of stars based on their spectrum and luminosity.
It appears that this distribution is not random at all: stars are classified into three distinct categories, or “sequences,” based on their spectrum-to-luminosity ratio. The main sequence, also known as the main track, extends from the upper left corner to the lower right corner. Our Sun is part of the main sequence. The brightest and hottest stars are located at the top of the main sequence, while the dimmest and longest-lived stars are found at the bottom right.
Located to the right and above are a cluster of stars with exceptionally high luminosity, which is not in proportion to their relatively low temperature. These stars are known as red giants and supergiants. Despite their immense size, they emit light without producing heat. On the lower left side of the main sequence, we find the dwarfs, a collection of relatively small and cool stars. It is worth reiterating that the majority of stars fall within the main sequence, where energy is generated through the process of thermonuclear fusion, converting hydrogen into helium.
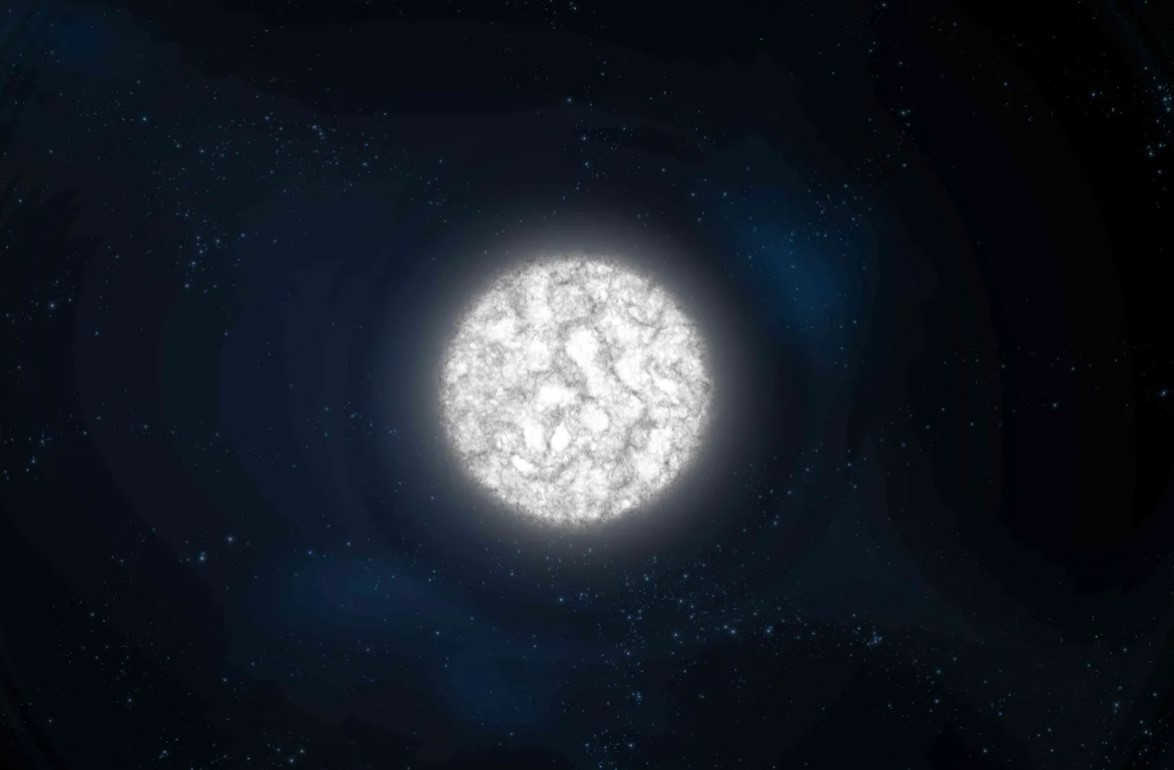
Finally, let’s take a look at the bottom left corner of the Hertzsprung-Russell diagram: this is where we find the white dwarfs. These stars are incredibly hot, but they’re also very small, often no larger than our planet Earth. As a result, they emit a relatively small amount of energy into space. However, due to their small surface area compared to other stars, they actually appear quite bright and have a high-temperature spectrum.
Overall, the entire life cycle of a star can be traced on the Hertzsprung-Russell diagram. Initially, a star forms from a cloud of gas and dust and becomes compact enough to reach the pressures and temperatures required for nuclear fusion. At this point, it appears on the main sequence of the Hertzsprung-Russell diagram.
While the star is undergoing fusion, it remains stationary on the main sequence, experiencing minimal movement. Once the star depletes its hydrogen fuel, it undergoes a phase of overheating and expands into a red giant or supergiant, moving towards the upper right corner of the diagram. Eventually, it cools down and contracts into a white dwarf, settling at the bottom left corner.
The segmentation into sequences was not simply a means to an end in constructing the diagram. The observed correlation between the star’s energy and radiation, which is linked to internal thermonuclear processes, serves as a visual representation of the most evident dynamics in the Universe – stellar evolution.