- Home
- Stars
Stars’ Spectral Classification
The spectra of stars serve as their identification documents that describe all the characteristics of the stars. Stars are made up of the same chemical elements found on Earth, but the lighter elements, such as hydrogen and helium, dominate in terms of percentage.
The passports of stars are the spectra that provide detailed information about their various characteristics.
By analyzing a star’s spectrum, we can determine its luminosity, distance, temperature, size, chemical composition of its atmosphere, rotation speed, and motion around the center of gravity.
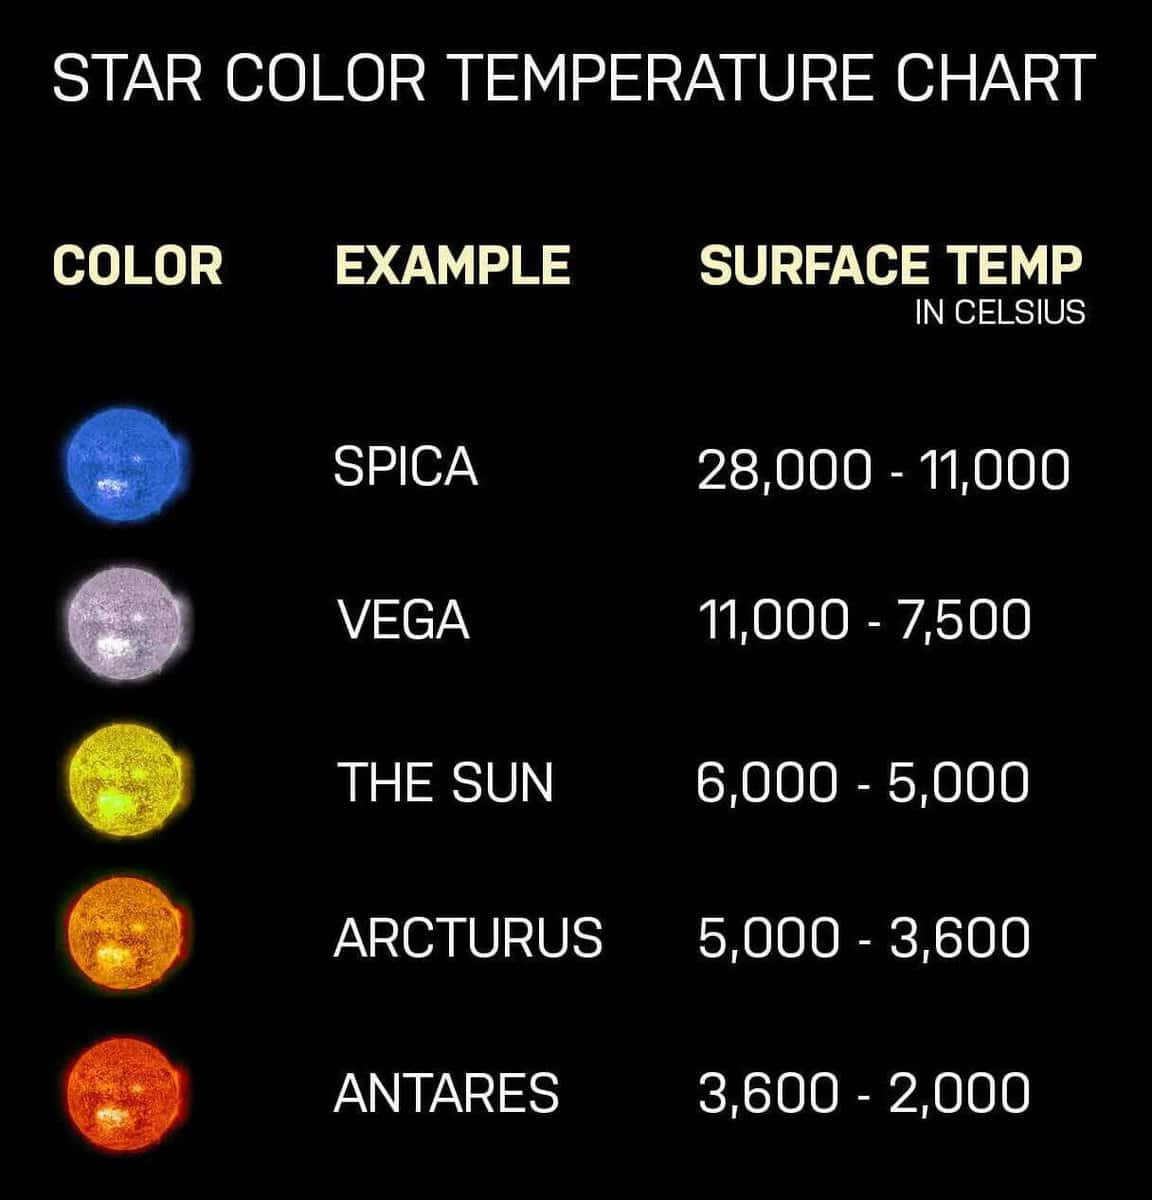
A telescope equipped with a spectral instrument separates the light from a star into different wavelengths, creating a spectrum. By analyzing this spectrum, we can determine the energy emitted by the star at various wavelengths and accurately estimate its temperature. The color and spectrum of stars are directly linked to their temperature. For instance, cooler stars with a photospheric temperature of around 3000 K emit predominantly red light. The spectra of these stars display numerous lines corresponding to metals and molecules. On the other hand, hotter blue stars with temperatures exceeding 10000-15000 K have most of their atoms ionized. Ionized atoms do not produce spectral lines, resulting in fewer lines in the spectra of these stars.
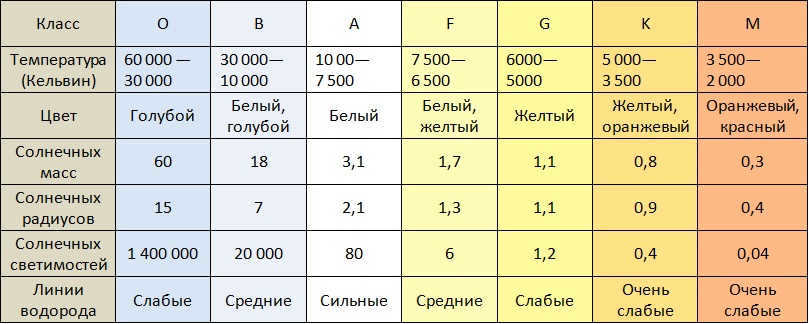
In the Harvard classification, the different spectral types (classes) are identified using the letters of the Latin alphabet: O, B, A, F, G, K, and M. Due to the lack of understanding about the relationship between spectral type and temperature at the time of developing this classification, it was necessary to rearrange the order of the spectral classes. Initially, the order of the classes coincided with the alphabetical arrangement of letters, but this had to be changed once the corresponding dependence was established.
Harvard’s Basic Classification of Stars by Spectral Type
Stars are classified into subclasses within their respective classes, ranging from 0 (hottest) to 9 (coolest). In the O class, the subclasses start at O5. The order of spectral classes reflects a gradual decrease in stellar temperature as we move from earlier to later classes.
The majority of stars fall within the O to M sequence. This sequence is uninterrupted, with star characteristics transitioning smoothly from one class to the next.
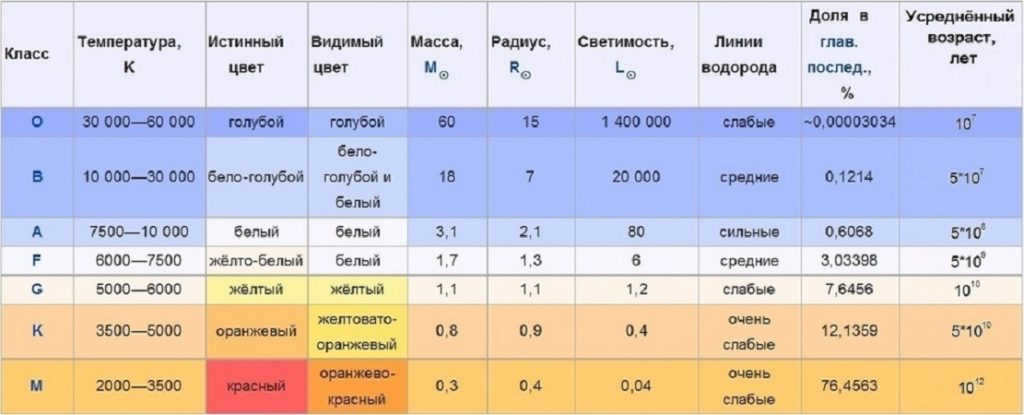
| Spectral class | Color | Temperature, K | Spectral features | Typical stars |
| O | Blue | 40000 | Intense lines of ionized helium, no metal lines | Mintaka |
| B | Blue-white | 20000 | Lines of neutral helium. Weak H and K lines of ionized calcium | Spica |
| A | White | 10000 | Hydrogen lines reach the highest intensity. H and K lines of ionized calcium, weak metal lines are visible | Sirius, Vega |
| F | Yellowish | 7000 | Ionized metals. Hydrogen lines are weakened | Procyon, Canopus |
| G | Yellow | 6000 | Neutral metals, intense lines of ionized calcium H and K | Sun, Capella |
| K | Orange | 4500 | Almost no hydrogen lines. Faint bands of titanium oxide are present. Numerous metal lines | Arcturus, Aldebaran |
| M | Red | 3000 | Strong bands of titanium oxide and other molecular compounds | Antares, Betelgeuse |
The classification system developed by Harvard is based on the presence or absence and relative intensity of specific spectral lines. In addition to the main spectral classes listed in the table, there are also classes N and R for cooler stars, which exhibit absorption bands of carbon molecules C2, cyanine CN, and carbon monoxide CO. Another class, S, is characterized by bands of titanium oxides TiO and zirconium oxides ZrO. For the coldest stars, there is a class L, which shows the chromium hydride band CrH, as well as lines of rubidium, cesium, potassium, and sodium. A special class, T, has recently been introduced for sub-stellar objects known as “brown dwarfs,” which have absorption bands of water, methane, and molecular hydrogen. These brown dwarfs are intermediate in mass between stars and planets.
The spectral classes O, B, and A are often referred to as hot or early spectral classes, while classes F and G are known as solar classes. Classes K and M, on the other hand, are referred to as cool or late spectral classes.
Due to the fact that stars with the same photospheric temperature can have different luminosity classes (meaning their luminosities can vary greatly), a classification system based on luminosity was created. This classification system is known as the Yerkes spectral classification (also referred to as ICC, which stands for the initials of its authors W. Morgan, F. Keenan, and E. Kelman).
According to this classification system, each star is assigned both a Harvard spectral class and a luminosity class.
The following luminosity classes are identified:
| Classification | Type | Absolute stellar magnitudes (MV) |
| 0 | Hypergiants | |
| Ia+ | Brightest supergiants | −10 |
| Ia | Brightest supergiants | −7.5 |
| Ib | Normal supergiants | −4.7 |
| II | Bright giants | −2.2 |
| III | Normal giants | +1.2 |
| IV | Subgiants | +2.7 |
| V | Main sequence dwarfs | +4 |
| VI | Subdwarfs | +5-6 |
| VII | White dwarfs | +13-15 |
Therefore, while the Harvard classification is responsible for determining the x-coordinate of the Hertzsprung-Russell diagram, the Yerkes classification is responsible for determining the star’s position on this diagram. An added benefit of the Yerkes classification is the ability to estimate a star’s luminosity based on its spectrum and, consequently, its distance based on its apparent magnitude (spectral parallax method).
For instance, the Sun, which is classified as a yellow dwarf, falls under the Yerkes spectral class G2V.
Stars with similar or nearly identical luminosity classes form sequences (branches) on the Hertzsprung-Russell diagram, such as the red giants branch or the white dwarfs branch.
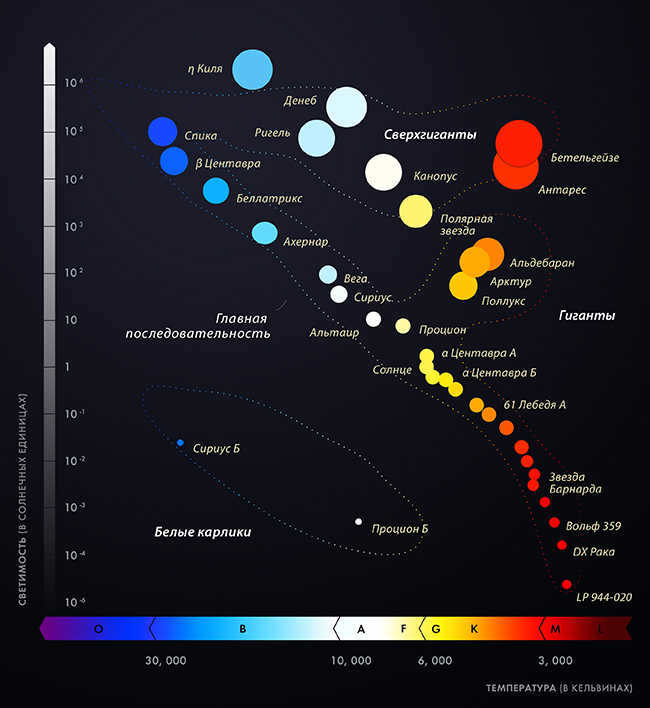
The Hertzsprung-Russell diagram: various representations
The Hertzsprung-Russell diagram was introduced by astronomers Einar Hertzsprung and Henry Russell in the early 20th century.
By utilizing this diagram, scientists can track the evolutionary path of stars, starting from young and hot protostars and progressing through the significant stages of development until they become red giants in their final phase. Moreover, the diagram illustrates how the temperature and color of stars change throughout their life cycle.
The sizes of the stars in solar radii are indicated by the inclined dashed lines in the lower diagram.
References – Wikipedia
Luminosity, spectrum, and classification
Spectral classification of stars
Stars of the Universe

Previously, we discussed the birth of stars in an earlier article. Today, we will continue our exploration of this topic by examining what occurs once a star is activated. Specifically, we will delve into the process of thermonuclear fusion and its aftermath. Additionally, we will gain insights into the principles behind the spectral classification of stars. So, without further ado, let’s dive in.
Hydrogen spheres
Let’s begin by stating that certain stars possess more hydrogen than others in absolute magnitudes. However, in all of these celestial bodies, the relative mass of hydrogen to the total mass of the star is extremely high.
The thermonuclear reactions involved in the “combustion” of hydrogen within stellar interiors vary. Yet, the most prevalent, or “classic,” if you will, appears as follows: four protons (hydrogen nuclei) combine to form a helium nucleus (two protons and two neutrons). This process releases two positrons and two electron neutrinos, along with an incredibly vast amount of energy in the form of photons.
At that precise moment, the surrounding red dwarfs wear wicked smirks. And, unveiling the curtains of their somber dwellings, they retreat to their forsaken chambers of the Universe, gradually, ever so slightly, trembling at every rustle, as they feed the invaluable hydrogen into the thermonuclear furnace for countless, suffocating eons….
Brrrr. Now, what was our conversation about? Ah, yes. Let’s continue.
Thus, we have acquired knowledge that the temperature of a young star can vary depending on the mass of the hydrogen cloud that birthed it. Consequently, the star can exhibit different hues and luminosities.
There are multiple methods to categorize stars. One popular approach involves considering their spectral class and luminosity. You may have encountered these alphanumeric codes before. For instance, our Sun is classified as a G2 (spectral class) V (luminosity) star.
However, what do these symbols signify?
Spectral classes of stars
The classification of stars based on their spectral class provides information about their color and surface temperature. In today’s discussion, we will delve into this fascinating characteristic of stars.
Let’s take the poker that is usually placed next to the stove’s door. Now, open the door and insert the poker inside. Allow it to remain in the stove for approximately five minutes before pulling it out. Do you notice the vibrant burgundy glow? If you leave the poker in the stove for a bit longer, you will observe it transitioning from dark red to orange, then yellow, and finally a whitish shade. Well, unless your stove happens to support controlled fusion, in which case it might even emit a bluish hue (just kidding).

Now we have a comprehension that the color of the light emitted by a poker is determined by its temperature. A similar phenomenon occurs with stars.
Now we will briefly examine the most common spectral classes, starting from the coolest stars and ending with the hottest ones. Stars are assigned spectral classes using letters. Initially, this classification was rather imprecise and rough. To refine it, numbers from 0 to 9 were added to the letters.
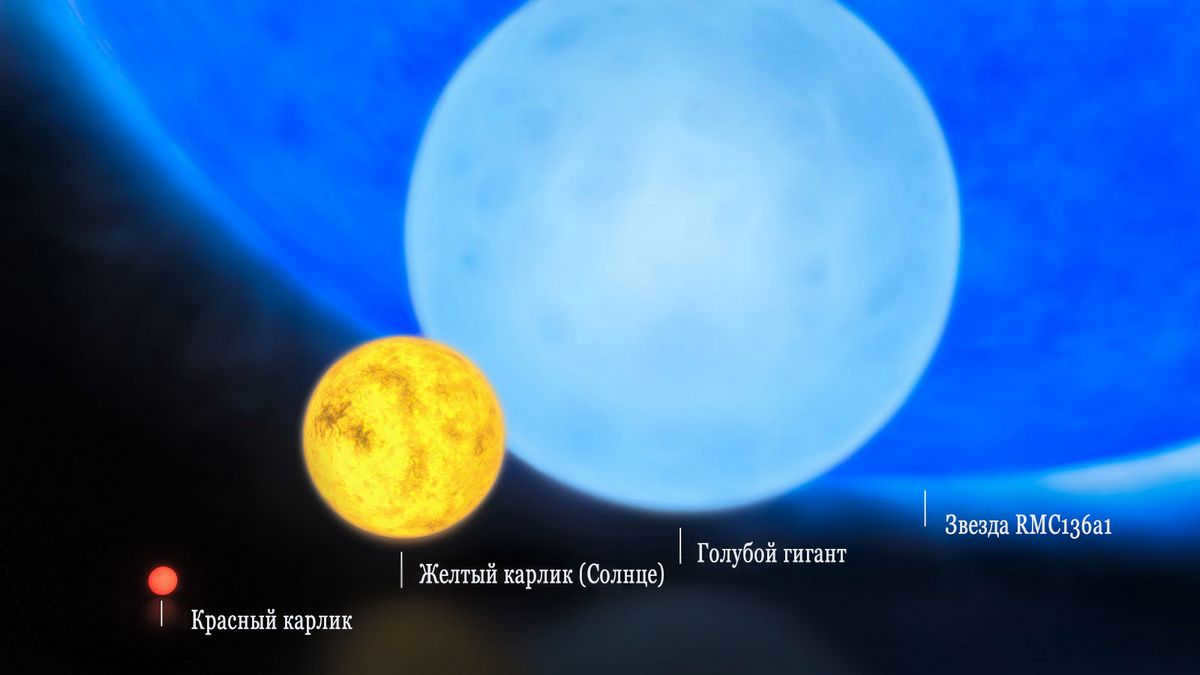
Class M stars, which make up three out of four stars in the Universe, are the most prevalent type of stars. These stars have surface temperatures ranging from 2000 to 3500 K, making them relatively cold compared to other classes (with M9 being the coolest at 2000 K and M0 being the hottest at 3500 K).
Despite their low temperatures, these red stars can vary in size, with a wide range of sizes observed.
One well-known star system is Alpha Centauri, which is the closest star system to Earth and located just over four light-years away. This system consists of three stars, one of which is Proxima Centauri, a small M5 class star. Proxima Centauri has a radius that is one-fifth the radius of our Sun and is currently the closest star to Earth after the Sun.
Furthermore, we have the colossal Betelgeuse in the vastness of space (located approximately 427 light-years away). It falls into the M2 category. This particular star boasts a radius that exceeds six hundred times the size of our very own Sun!
Category K
Following suit, we have stars that fall into the K category. These stars exhibit a distinct orange hue. The temperature of their surface ranges from 3,500 to 5,000 K.
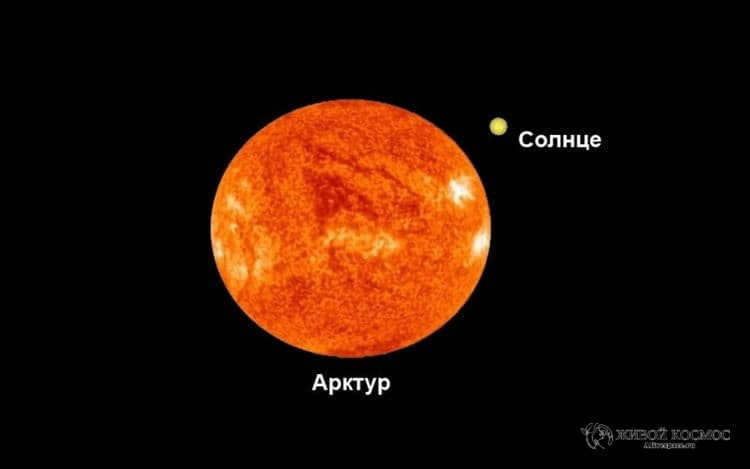
About 13% of the stars that astronomers have observed are classified as K stars. Some of them, like Alpha Centauri B, are of average size. However, there are also colossal K stars, such as Arcturus.
Spectral Class G
Now we will discuss the spectral class of our Sun, which falls under the category of G-class stars. These stars are characterized by a yellow-white color and are relatively uncommon in the vast expanse of space. In fact, only 8% of stars belong to the G-class category. Some notable G-class stars, aside from our Sun, include Alpha Centauri A, Capella, and Tau Kita. It is worth mentioning that our Sun specifically belongs to the G2 class of stars.
Class F
Now let’s discuss stars that are hotter than the Sun. These stars belong to the class F. They have a white appearance and their surface temperatures range from 6000 K to 7500 K. Only 3% of the stars observed fall into this category. Canopus, the second brightest star in the night sky, is classified as a class F star.
Class A
However, there are even hotter stars known as class A stars. These stars have temperatures ranging from 7,500 K to 10,000 K and emit a bluish-white light.
Class A stars have been a topic of interest for thousands of years. Due to their high temperatures, they shine brightly and can be seen with the naked eye. Some examples of these stars are Vega and Deneb. The brightest star in the night sky, Sirius (specifically Sirius A, as it is part of a double system), is also classified as a Class A star.
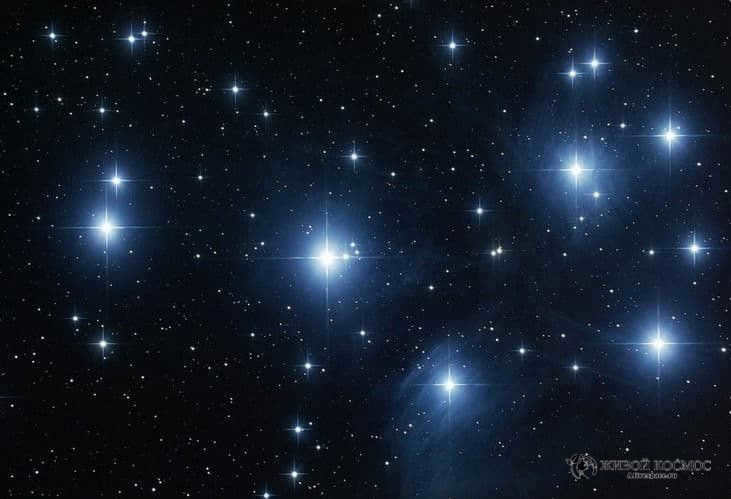
However, our work is not yet completed! This is because there exist additional celestial bodies that possess surface temperatures ranging from 10,000 to 30,000 K. These particular stars are categorized under the spectral class B. The captivating feature of these stars is their deep blue luminosity. However, due to their intense heat, their lifespans tend to be relatively short. In the vast expanse of the cosmos, stars of this class are quite scarce. This is primarily because their formation necessitates a high concentration of hydrogen. Merely one in every eight hundred stars belongs to the class B category. These stars have a tendency to be born in clusters within regions of space where dense gas clouds once resided.
A prime example of such a cluster is the renowned Pleiades cluster.
Class O
However, that’s not the end of it. The Universe also has stars that are even hotter! Although they are quite rare. These stars belong to the class O. They have temperatures ranging from 30,000 to 60,000 K and emit a blue glow, similar to Class B stars. What sets them apart is their ability to emit more energy in the ultraviolet range compared to the visible part of the spectrum. Only one out of every three million stars falls into this category. The formation conditions for these stars are extremely complex. Additionally, they have a very short lifespan, resulting in the disappearance of most similar stars that formed in the past.
Rules for Classifying Stars Using Mnemonics
So, to summarize briefly. The letter code assigned to stars may seem illogical at first glance. However, there is a reason behind it – the code is based on the spectral lines of hydrogen and other elements. To help remember the order of spectral classes, mnemonic rules were created. One of the most well-known mnemonics in English is “Oh, Be A Fine Girl, Kiss Me.”
The Russian equivalent is “One Shaved Englishman Chewed Dates Like Carrots.”
Dear friend! If you want to show appreciation to the authors, get involved! Subscribe, share, like, comment – all of these actions are simple and completely free! Thank you so much!
You might also enjoy these selections:

It appears that the classification of stars into classes is determined by their emission, or more precisely, their spectrum. Each type of spectrum has distinct differences. These differences are actually related to the physical characteristics of stellar atmospheres, including temperature, pressure, magnetic and electric fields, chemical composition, and body motion.
Spectrum – the distribution of radiation by frequency or wavelength.
While the classification of objects is primarily based on their absorption and emission spectra, it has been refined over time with new data. Let’s explore the different classes of stars.
Angelo Secchi’s Classification of Stars
This classification is named after its creator, Angelo Secchi, who studied celestial bodies between 1860 and 1870. He categorized stars based on their radiation intensity.
According to Secchi’s classification, stars are organized in descending order of surface temperature, which in turn affects their color.
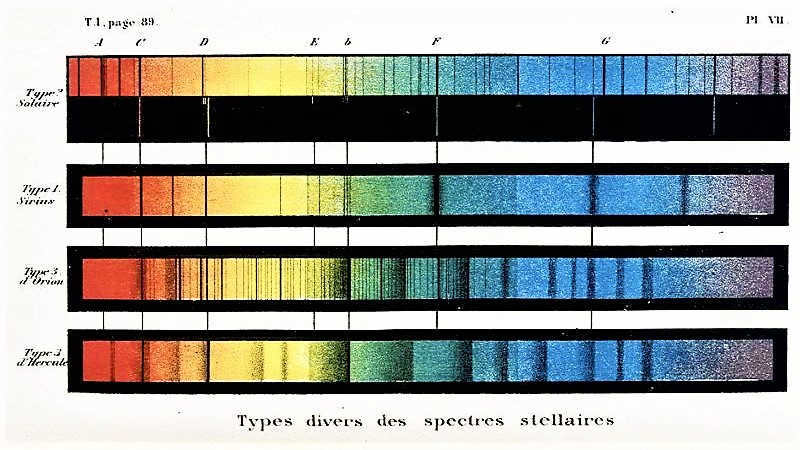
- Angelo Secchi categorized stellar objects into different classes based on their color and spectral lines.
- Class I includes white and blue stars with broad hydrogen absorption lines in their spectrum. This class also includes stars like Orion, which have narrow lines.
- Class II consists of orange and yellow stars with faint hydrogen lines but clear lines of metals.
- Class III encompasses orange and red stars with a spectrum where the line bands darken closer to blue.
- Lastly, Class IV comprises red stars with strong carbon lines and bands. These stars are commonly known as carbon stars.
Later, Class V was classified by Secchi, which consists of stars that have emission lines in their spectra. It is important to mention that this category was later modified by Edward Pickering. He further subdivided hot objects based on the presence of helium, carbon, and nitrogen emission lines, and included planetary nebulae in this class.
Angelo Secchi’s original classification of celestial objects remained valid until the early 1900s.

The Classification of Harvard Spectra
In the years 1890-1924, researchers at the Harvard Observatory devised a novel system for categorizing the spectral lines of absorption and emission in celestial bodies.
Thus, the Harvard classification was born, serving as the foundation for modern classification methods. It is often referred to as a temperature classification due to its reliance on the type and intensity of emission and absorption lines in the spectra of celestial bodies. However, its primary purpose is to group bodies based on their luminosity.
The primary categories of stars
There are actually seven distinct spectral classifications that correspond to the thermal characteristics of celestial bodies. Each of these classifications is further divided into subcategories ranging from 0 to 9, indicating the progression from the hottest to the coolest stars.
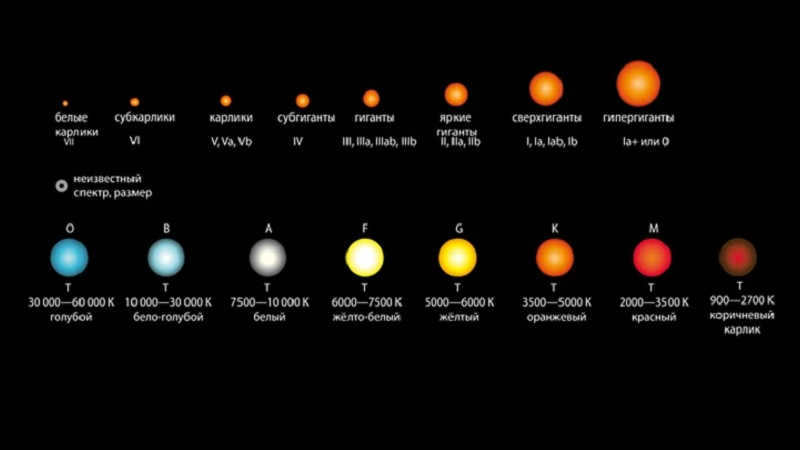
Consequently, an additional designation has been incorporated for luminaries:
- Ia+ or 0 – hypergiants,
- I, Ia, Iab, Ib – supergiants,
- II, IIa, IIb – bright giants,
- III, IIIa, IIIab, IIIb – giants,
- IV – subgiants,
- V, Va, Vb – dwarfs (main sequence stars),
- VI – subdwarfs,
- VII – white dwarfs.
It is noteworthy how the stars were classified based on their size. This categorization proves to be highly useful in providing a general overview of celestial objects.
This classification is often referred to as the ICC, which is an acronym for its authors’ names.
The life cycle of a star from each spectral class is most effectively illustrated in the Hertzsprung-Russell diagram.
Without a doubt, the classification of celestial bodies has enabled scientists to not only recognize their shared characteristics, but also push the boundaries of their exploration. Furthermore, this categorization highlights the diverse nature of these objects.
The classification of stars is based on their electromagnetic radiation spectrum, which allows us to obtain crucial data about their temperature, pressure of the upper layers, chemical composition, rotation speed, and other physical properties.
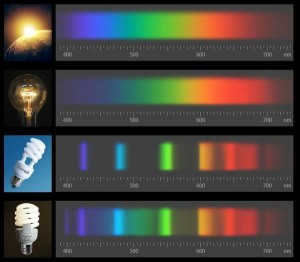
Emission spectra of various light sources
In a basic scenario, the spectrum can be acquired in the following manner: light emitted from an object is transmitted through a narrow opening, where a prism is positioned. The prism then bends the light, which is subsequently focused onto a screen or specialized photographic film. The resulting depiction presents a seamless progression of hues ranging from purple to crimson. A spectrum lacking any dark lines is referred to as a continuous spectrum. A comparable visual is witnessed when light is emitted by solid or liquid entities, such as an illuminated bulb.
Let’s take into account the given scenario: imagine a burner with a specific amount of salt placed in its flame. In this situation, the flame will emit a vibrant shade of yellow. Furthermore, if we observe these vapors through a spectroscope, we will witness a distinct yellow line. This signifies that the heated sodium vapor is radiating light with a wavelength that corresponds to the color yellow. This particular characteristic can be found in any substance when it is in a gaseous state, and its spectrum is referred to as linear.
While studying the Sun, Joseph Fraunhofer, a German optician, made an interesting observation. He noticed the presence of narrow black lines in the Sun’s continuous emission spectrum. This discovery sparked further investigations, and Gustav Kirchhoff later determined that these black lines were caused by the absorption of light rays at specific wavelengths by rarefied gases in the Sun’s atmosphere. These gases emit light themselves while in a state of luminescence.
These black lines, now known as absorption lines, became a crucial tool for scientists in identifying the chemical composition of the Sun’s atmosphere. By studying the wavelengths at which radiation was absorbed, researchers were able to determine the types of gases present in the Sun’s atmosphere.
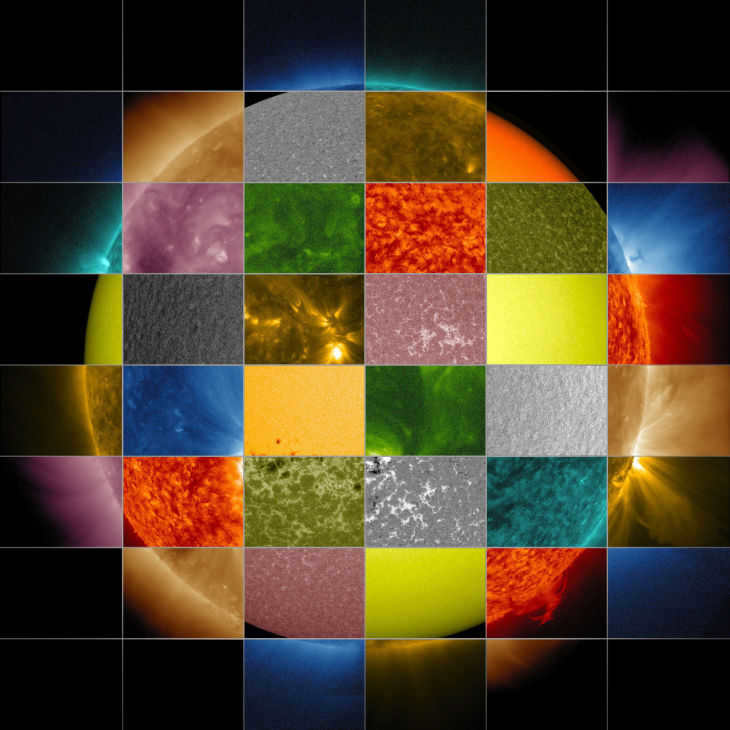
There are 40 unique spectra of the Sun.
Subsequently, spectroscopy has introduced numerous techniques for examining additional characteristics of stars, including the directional shift of spectra, comparison with the spectrum of a completely dark object, and the separation of overlapping lines.
Presently, scientists employ various filters and eyepieces, such as X-rays or ultraviolet, to measure star spectra in any non-optical range.
Angelo Secchi’s lectures
Angelo Secchi, an Italian priest and astronomer, was the first to classify stellar spectra. In 1866, he grouped all celestial luminaries into three categories based on the surface temperature of the star and its corresponding color. Over the next 11 years, Secchi expanded his classification to include two additional classes.
- Class I – consists of celestial luminaries that appear blue or white in color. Their spectra exhibit broad lines of hydrogen absorption. According to modern classification, these stars belong to type A and partially type F, such as Vega or Altair. This category also includes a subclass of stars with narrow Fraunhofer lines, which marks the beginning of class B. Examples of stars in this subclass are Rigel and Orion’s γ.
- II – Stars that are orange or yellow in color. They exhibit few hydrogen absorption lines and notable metal absorption lines. Our Sun, also known as Capella in the constellation of Ascendant, belongs to this category. In the modern classification, these stars are classified as G, K, and the latter part of F.
- III – Celestial bodies that have an orange or red hue (classified as type M). They possess distinct absorption lines in the blue spectrum, including metals, as well as faint hydrogen, calcium, and potassium lines. Examples of this type of star are Antares and Betelgeuse.
- IV – These stars, known as carbon stars, have a reddish color.
- V – These celestial bodies have a spectrum characterized by both absorption and emission lines.
Classification of stars by Harvard
The classification of stars by Harvard was developed between 1890 and 1924 by scientists from the Harvard Observatory. It gradually replaced Angelo Secchi’s classification and has since become the primary method used today. The Harvard classification is based on the relative intensities of absorption lines and Fraunhofer lines, as well as the color of stars.
The table displays the different spectral classes of stars.
Each class has 10 subclasses ranging from 0 to 9, with 0 representing the hottest stars and 9 representing the coolest. The O class is an exception, as it is divided into subclasses 4 to 9.5.
The Yerkes classification, which considers luminosity, is as follows:
In 1943, the Yerkes classification was formulated at the Yerkes observatory, which considers the luminosity of stars, hence its name. It is also known as the ICC – an acronym formed from the initials of the scientists W.W. Morgan, P.C. Keenan, and E. Kellman. The main difference from the Harvard classification is that it incorporates the crucial characteristic of a celestial luminary – its luminosity. Later, Einar Herzsprung from Denmark and Henry Russell from the USA represented the Yerkes classification as a diagram depicting the relationship between spectral class and luminosity. This visual representation allows us to observe the patterns in the properties of stars of various types.
Ia+ or 0 represent supergiants with the highest power, mass, brightness, and short lifetimes;
Topic-based Materials
This diagram also enables us to ascertain the brightness of a star, if its spectrum is obtainable. In line with the classifications mentioned above, the Sun is currently categorized as G2V.
There are numerous supplementary spectral classes for more unconventional entities. As an instance, Q – for fledgling stars, P – for planetary nebulae, D – for white dwarfs, W – for the most scorching luminaries, whose temperature surpasses that of class O stars and can reach approximately 100,000 K.
Clearly, every star, despite being a part of a specific category, remains an individual and one-of-a-kind entity, much like a human being. Consequently, there exist various supplementary letter designations which signify the attributes of the celestial body. The letter preceding the spectral class denotes the star’s type: dwarf (d from dwarf), supergiant (c), giant (g), subgiant (sg), subdwarf (sd), white dwarf (w or wd).
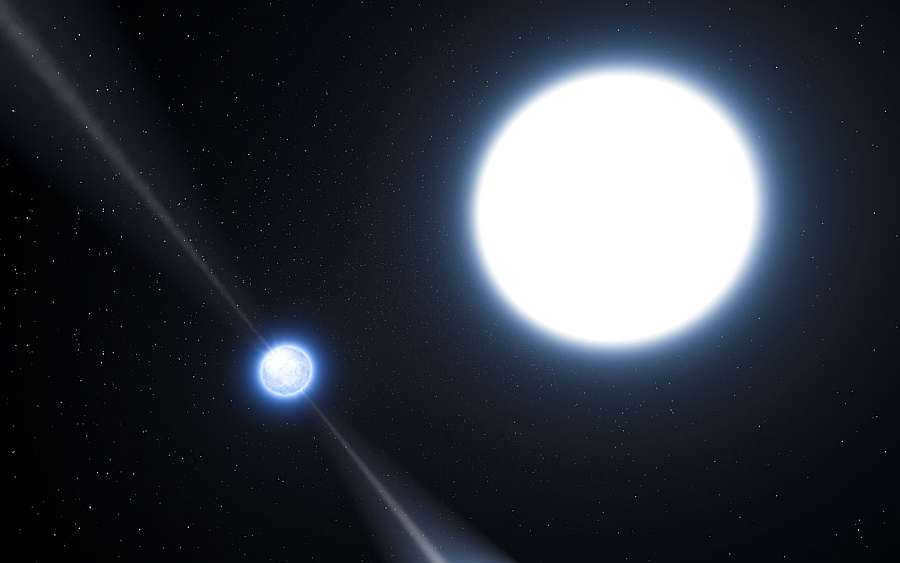
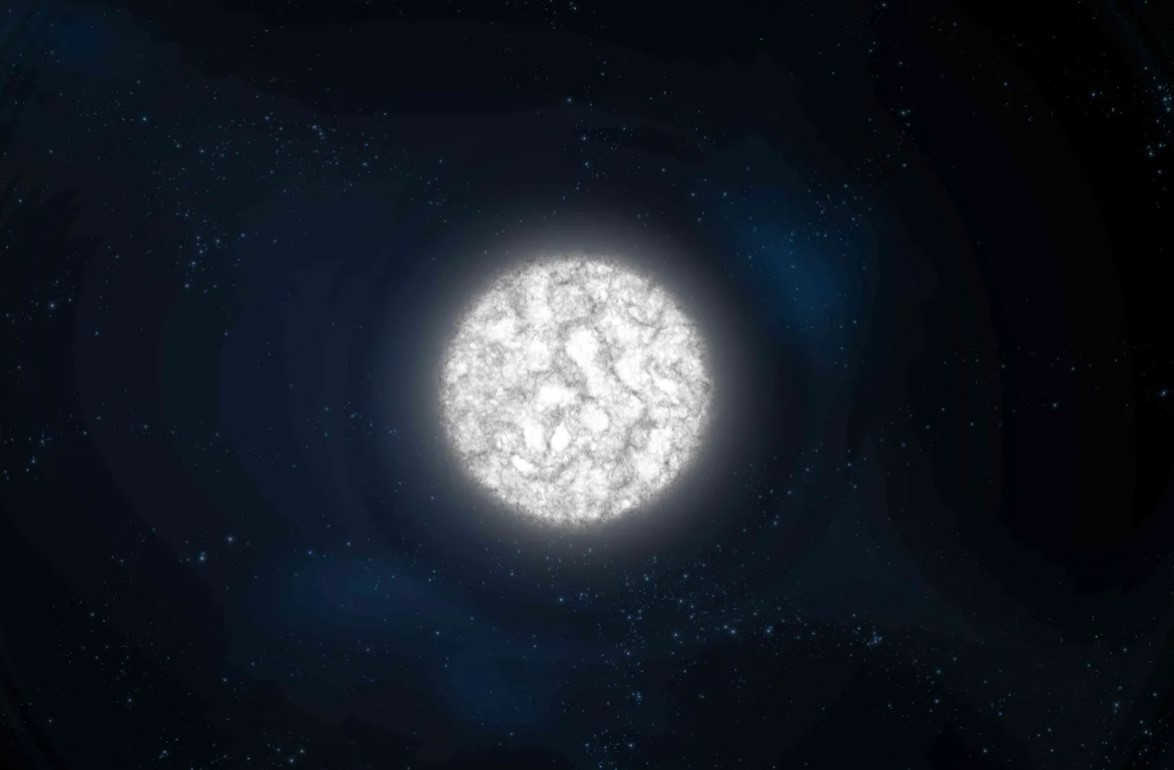
The Pulsar PSR J0348 +0432 is a combination of a neutron star and a white dwarf.
Various characteristics of a star can be determined by analyzing its spectrum, and there are numerous letter designations used to describe these features. For example, strong metal lines are indicated by the letter “m,” while sharp and narrow lines are denoted by “s.”
By utilizing the spectral classes mentioned above, astronomers are able to provide a concise summary of the primary characteristics and attributes of a celestial object. For instance, the most prominent celestial body in the nocturnal sky, Sirius AB, is a binary star system with a spectral class of A1Vm/DA2. This classification signifies that the visible star, Sirius A, falls under the A class with a temperature subclass of 1, indicating its status as a main-sequence dwarf and its possession of strong metal lines denoted by the letters “V” and “m”. On the other hand, its companion, Sirius B, is classified as a yellow dwarf with a subclass of 2, featuring an atmosphere rich in hydrogen but devoid of helium, which is reflected in its spectrum by the presence/absence of respective lines denoted by the letter A.
If you found this entry interesting, don’t hesitate to share it with your friends!

If you have any comments or questions about the paragraph, please feel free to add them on the discussion page.
Stars. Sun [ edit correct code ]
Relationship between the luminosity, color, and temperature of a star [ edit correct code ]
The luminosity, color, and temperature of a star determine its spectral class.
Spectral class refers to a star’s characteristic that is associated with its temperature, luminosity, color, and type of spectrum.
Stars are classified into ten spectral classes, which are represented by the letters W, O, B, A, F, G, K, M, L, T. The table provided below illustrates the spectral classes of stars, along with the corresponding color and temperature of each class.
The connection between neutron stars and white dwarfs [ edit edit code ]
White dwarfs are created from stars that have a mass lower than 1.44 solar masses when they reach the end of their lifespan. The stability of a white dwarf is maintained by the resistance of the degenerate electron gas to gravitational pressure.
Neutron stars are created through the gravitational collapse of stars that are more massive than those that form black holes. They remain stable due to the pressure exerted by degenerate neutron gas. It can be said that the immense gravitational pressure during the collapse overwhelms the pressure from the degenerate electron gas, which is not enough to prevent the star from shrinking. As a result, the gravitational pressure forces electrons to combine with protons, leading to the formation of neutrons. Consequently, a neutron star consists solely of neutrons and is significantly smaller than a typical white dwarf, measuring about six hundred times smaller, despite being more massive.
There are two types of star clusters, scattered and globular.
Scattered star clusters are named as such because individual stars can be easily distinguished. The Hyades and Pleiades are examples of scattered star clusters, where individual stars can be seen with the naked eye. These clusters are located in the dusty spiral arm region and are referred to as galaxy clusters. They formed from the same cloud of molecules and can contain hundreds of stars.
Star clusters suggest the existence of a gravitational connection between objects, albeit a weak one. The cluster rotates around the galactic group, and eventually disperses due to gravitational interactions with stronger objects.
Globular objects, on the other hand, form a spherical gravitational system that can house thousands to millions of objects. They reside in the halo region and are older members of the second population of stars. While highly developed, their metallic properties are exceptionally low.
Star clusters of this kind are quite ancient, as each individual star has already passed through the main sequence. They contain a limited amount of dust and gas due to the absence of new object formation. Their density is significantly higher compared to the regions near the Sun.
In the case of globular clusters, the stars also have a common origin. However, this type of cluster holds its objects more tightly due to the gravitational force, as there is no dispersion of stars. The Milky Way is home to approximately 200 globular clusters. Examples of such massive star clusters include 47 Tucanae, M4, and Omega Centauri. It is possible that the latter object functions as a spheroidal galaxy. [1]
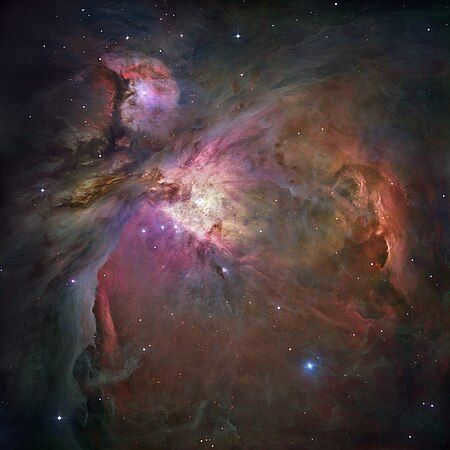
The Orion constellation [ edit edit code ]
- Produce a document on a star configuration. Elucidate a myth that elucidates the origin of its name.
Orion is a well-known constellation that is located on the celestial equator and is considered one of the brightest and most popular constellations. It has been recognized since ancient times and is often referred to as the Hunter, as it is associated with mythology and represents the hunter Orion. In depictions, Orion is often shown standing in front of Taurus or in pursuit of a Hare, accompanied by two dogs known as the Big Dog and the Little Dog. The constellation Orion is home to two of the ten brightest stars, Rigel and Betelgeuse, as well as famous nebulae such as the Orion Nebula (M42), the Del Meran Nebula (M43), and the Horsehead Nebula. Below Orion, you can also find the notable asterism known as Orion’s Belt, as well as the Trapezium cluster.
Orion is the 26th largest constellation, covering an area of 594 square degrees. It occupies the first quadrant in the northern hemisphere (NQ1) and can be observed at latitudes ranging from +85° to -75°. It is bordered by the constellations Aridnus, Gemini, Unicorn, Taurus, and Hare.
Within Orion, there are 3 Messier objects: Messier 42 (M42, NGC 1976), Messier 43 (M43, NGC 1982), and Messier 78 (M78, NGC 2068), along with 7 stars that have planets. The brightest star in Orion is Rigel, with a visual magnitude of 0.18. Rigel is also the 6th brightest star overall. The second brightest star in Orion is Betelgeuse (0.4Z), which ranks 8th on the list of brightest stars. Orion is home to two meteor streams: Orininae (October 21) and Chi Orininae. This constellation is part of the Orion group, which also includes the constellations Hare, Unicorn, Great Dog, and Little Dog. Refer to the star map for a visual depiction of the constellation Orion.
In a different legend, he was infatuated with Merope (the daughter of King Enopolis), but she did not feel the same way. One night, he became intoxicated and attempted to force himself upon her. In response, the furious king blinded him and banished him from his kingdom. Hephaestus took pity on him and sent one of his assistants to restore his sight. Eventually, Orion encountered the Oracle, who prophesied that he would regain his vision if he reached the eastern horizon before sunrise. And miraculously, it happened.
The ancient Sumerians were also familiar with the story of Orion through the myth of Gilgamesh. In their own tales, they had heroes who were compelled to battle the celestial bull (Taurus – GUD AN-NA). They referred to Orion as URU AN-NA – “the illuminator of the skies”.
Although he was often shown battling a bull in maps, there is no mythological connection to this subject. Ptolemy described him as a heroic figure wielding a club and wearing a lion’s skin, which is typically associated with Heracles. However, due to the constellation’s lack of prominence and Heracles’ famous encounter with a bull, some have speculated a potential link between the two.
Almost all stories about his death involve the scorpion. In one version, Orion bragged to Artemis and her mother Leto that he could defeat any creature on Earth. In response, Leto sent a scorpion to kill him with its deadly venom. Alternatively, Orion attempted to win Artemis’ love, and she too sent a scorpion to kill him. In another tale, Orion died from poison while trying to protect Leto. Regardless of the variation, the outcome remains the same – a lethal scorpion sting. Both Orion and the scorpion are immortalized in the night sky, with Orion rising in the west, seemingly fleeing from his killer.
However, there is another story. Artemis fell in love with a hunter, but Apollo did not want her to surrender her virginity. He gave her a bow and arrow and instructed her to shoot at a small target. Unaware that the target was Orion, she inadvertently killed the man she desired!
Pharaohs were worshipped as deities by their subjects, which is why the majority of the pyramids (at Giza) were constructed to mirror the constellation. For the Aztecs, the emergence of stars in the sky signified the commencement of the New Fire ceremony. This ritual was crucial as it postponed the predicted end of the world.
In Hungarian folklore, Nimrod, the hunter and father of the twins Hunor and Magor played a significant role. Scandinavians associated him with the goddess Freya, while in China he was known as Shen (hunter and warrior). During the second millennium BC, the Hittites developed a legend about the goddess Anat who fell in love with a hunter. When he refused to lend her his bow, she dispatched a man to steal it. However, the man failed and accidentally dropped the bow into the sea. Consequently, the constellation disappears below the horizon for two months in the spring. [2]
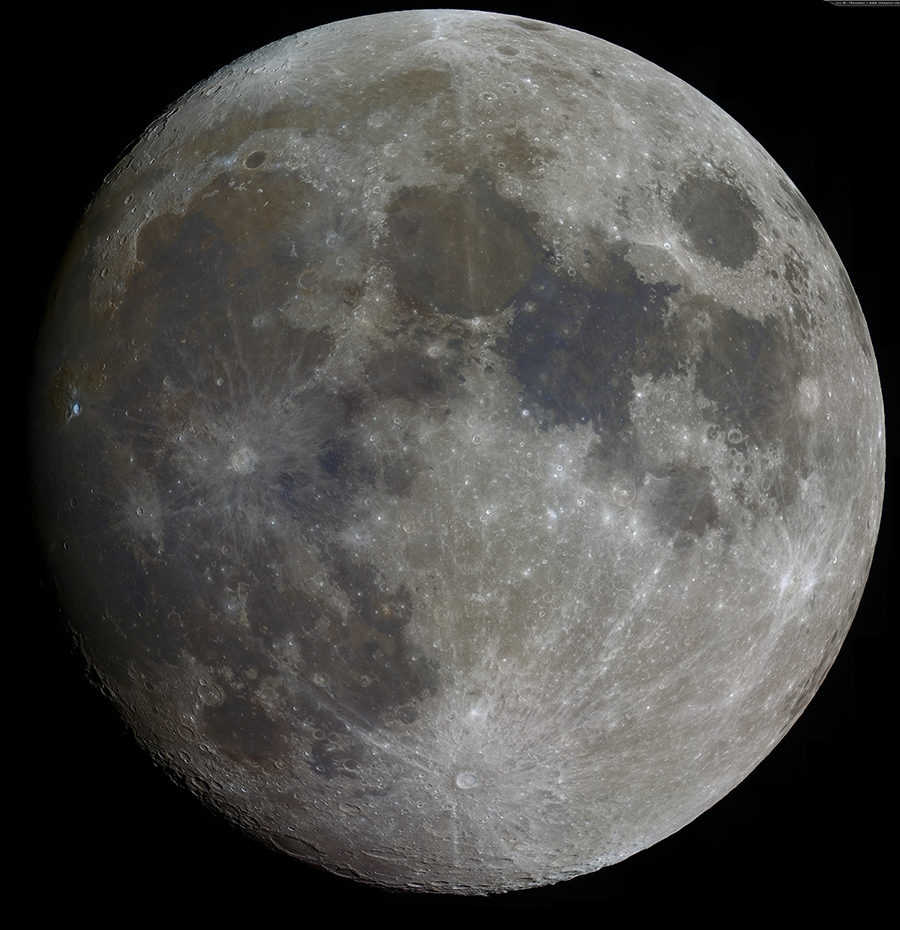
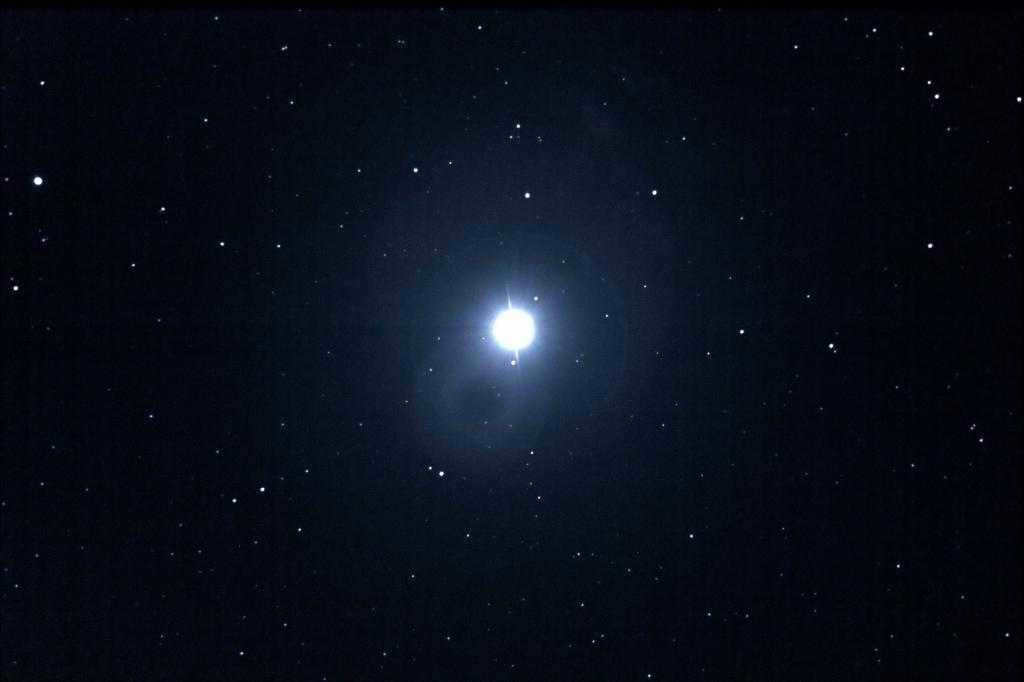
The Sun is a yellow dwarf [ edit edit code ]
The Sun is a blazing orb composed of hydrogen and helium undergoing continuous thermonuclear reactions. This process generates an immense amount of energy, a fraction of which sustains life on Earth. This fiery fusion ball is classified as a main-sequence star. It is often referred to as a main sequence star.
Our home star is known as a “yellow dwarf” or “a yellow dwarf star”. In cosmic terms, it is relatively small and has a yellow hue, although it appears white to the human eye. Unfortunately, the lifespan of a yellow dwarf is disappointingly brief, lasting only about 10 billion years. This may seem like an absurdly long time, but in the grand scheme of the universe, it is relatively short. This is the amount of time it takes for hydrogen to completely transform into helium. [3]
Isaac Newton’s experiments in obtaining spectra of solar radiation using a prism [ edit correct code ]
- Create a report on Isaac Newton’s experiments in obtaining spectra of solar radiation using a prism.
As we are aware, Newton referred to the resulting pattern of colored bands as dispersion. In the dispersion he observed, he identified the colors red, orange, yellow, green, blue, blue, and violet. These colors were referred to by him as monochromatic colors, and he believed that “All colors equally pertain to any boundaries of a shadow, and therefore the distinction between colors does not arise from different boundaries of a shadow, contrary to the belief held by philosophers until now.”
After passing the light flux that was separated by the first prism through the second prism, Newton made the observation that there was a consistent pattern in the different color components he selected – these color components had varying refractive indices.
Therefore, it is important to note that Newton specifically conducted the dispersion on a very narrow aperture, possibly no larger than the diameter of a pin.
- The prism does not alter the light, but rather separates it into its individual constituents.
- Light rays of different colors have varying degrees of refractibility; violet rays are refracted the most, while red rays are refracted to a lesser extent.
- Red light, being less refracted, has a higher velocity compared to violet light, which is why the prism separates light.
- A prism separates light.
- Compound (composite) light is the combination of different wavelengths.
- Violet rays have a stronger refraction than red rays.
- The frequency of vibration determines the color of a light ray.
- When light moves from one medium to another, the speed and wavelength change, while the frequency, which determines the color, remains constant.
- White light consists of wavelengths ranging from 380 to 760 nm.
- The color of an object is perceived by the eye through the reflected rays of a specific wavelength. [5]
Surviving Ancient Constellations on Historical Star Maps
- Identify the constellations that were depicted on ancient star maps and still retain their original names today.
During the inaugural Congress of the International Astronomical Union (IAU) in 1922, astronomers sought to bring order to the heavens. The entire celestial sphere, encompassing both the Northern and Southern hemispheres, was divided into 88 distinct regions or constellations, each with well-defined boundaries. Ever since, it has been widely accepted that there are precisely 88 constellations in the Earth’s sky, with only 48 of them tracing their origins back to ancient times.
The Sun Worship of Ancient Civilizations [ edit edit code ]
- Explore the reasons behind the prevalence of sun worship among various ancient civilizations, using the ancient Egyptians and the ancient Slavs as examples.
The sun worship in ancient Egypt. Despite the prominence of ancestor worship and funerary rites, the Cult of the Sun played a significant role in ancient Egypt. “To the Egyptians, the sun represented a powerful celestial force, reigning over the lifeless desert, while also symbolizing the source of warmth and light necessary for human existence.”
One of the most significant religious centers in ancient Egypt was Heliopolis, also known as the “City of the Sun”. As the Egyptian state became more centralized, the sun god Ra emerged as the central deity in the Egyptian pantheon. Ra was often depicted as a falcon, a snake, or a man with the head of a falcon.
The sun disk, married to Urey, was the primary symbol associated with Ra. However, before Ra became recognized as the sole sun god in ancient Egyptian mythology, there were two other important figures: Atum and Khepri. Atum represented the primordial creation and embodied both feminine and masculine qualities, similar to other demiurge gods. Atum was associated with the evening, representing the setting sun. Khepri, on the other hand, represented the morning aspect of the sun god and symbolized the rising sun. Khepri was often depicted as a scarab beetle.
Over time, Ra, the solar deity, eventually emerged as the primary solar god, with Atum and Khepri serving as his manifestations. This can be seen in chapter 17 of the Book of the Dead, where the Supreme God describes himself as follows: “I am Atum, the being, the singular one. I am Ra during his initial ascension. I am the mighty god who brought himself into existence, the one who gave himself the title ‘lord of the ennead.’ I have existed in the past; I possess knowledge of the future.” [7]
The worship of Ra in Heliopolis started to grow during the 2nd dynasty of pharaohs, who declared Ra as the god of the sun. The pharaohs of the IV dynasty were believed to be embodiments of Ra on earth and referred to themselves as “sons of Ra”. The reverence for Ra reached its peak during the V dynasty, when Ra became a state deity and pharaohs built dedicated pyramids, obelisks, and solar temples in his honor. The rulers of the V dynasty claimed to be direct descendants of Ra and the wife of the high priest of Heliopolis. These pharaohs spent vast amounts of money on sun temples. It was during this time that the Pyramid Texts emerged, emphasizing the significance of Ra in the pharaoh’s journey through the underworld.
In the Middle Kingdom, Ra started to be closely associated with other important deities, particularly Amon and Osiris.
Ra’s worship was accompanied by hymns, prayers, and incantations in order to aid this deity and his solar vessel in overcoming the serpent Apop.
With the establishment of Christianity in the Roman Empire, the veneration of Ra in Egypt came to an end. The cult of Ra now elicited only scholarly interest, even among Egyptian priests. [8]
The worship of the Sun among the ancient Slavs. The veneration of the Sun has been prevalent among the Slavic people since ancient times. There is a belief that the very name “Slavs” means “those who come from the Sun,” thereby alluding to the ancient myth about the Slavs’ origin from the Sun.
The sun was conceptualized by the ancient Slavs as a celestial blaze, a celestial wheel that sustains life. It was personified as a living entity and its voice was spoken for by priests, Magi, and other religious servants. Festivals such as Ivan Kupala, Kolyada, and the reign of winter were dedicated to honoring the sun. The Sun was referred to by different names by various tribes, including Dazhbog, Yarilo, Kupala, Kolyada, and Troyan.
Yarilo, the god of the spring sun, Kupalo, the god of the elderly sun, and Kolyada, the god of the winter sun, were all prominent deities in pagan Russia. Dazhbog, another important god in the pantheon, was specifically associated with the sun. The name Dazhbog is derived from the words “dai,” meaning “to give,” and “god,” meaning “god,” signifying his role as the god who gives life. The Trojans were believed to represent three suns in one, symbolizing three Yangs. Jan, on the other hand, was also revered as the sun god among the Slavs. The concept of a triune sun deity, consisting of three interconnected beings, was a common belief shared by various religions and the Slavs embraced this idea as well.
Old Russian preachers discouraged referring to the Sun and fire as gods. The veneration of the celestial fire, represented by the Sun, was justified by its ability to stimulate grain growth and aid in the formation of “ergot.”