Spectral classes refer to the categorization of stars based on their emission spectrum, specifically the temperature of their photosphere.
Initially, a star’s emission spectrum closely resembles that of a blackbody with a temperature equivalent to its photosphere temperature, which can be estimated using the Wien displacement law. However, this method is not applicable for distant stars due to the non-uniform absorption of light across the spectrum by the interstellar medium. A more precise approach involves optical spectroscopy, which allows for the observation of absorption lines in star spectra that vary in intensity based on the temperature and type of star. In some cases, emission lines can also be observed in the spectra.
Angelo Secchi’s courses
During the 1860s and 1870s, Angelo Secchi, the trailblazer of stellar spectroscopy, developed the initial categorization of stellar spectra. In 1866, he classified the observed spectra of stars into three groups based on decreasing surface temperature and the resulting change in color [1] [2] [3]. In 1868, Secchi identified carbon stars, which he placed in a distinct fourth category [4]. Additionally, in 1877, he introduced a fifth class [5].
- Class I – Comprised of white and blue stars with prominent hydrogen absorption lines in their spectra, such as Vega and Altair; encompasses modern Class A and the beginning of Class F.
- Orion subtype, belonging to Class I – This category includes stars in Class I that have narrow lines in their spectrum instead of broad bands. Examples of such stars are Rigel and Orion’s γ. This subtype marks the transition from the traditional Class B classification to the modern one.
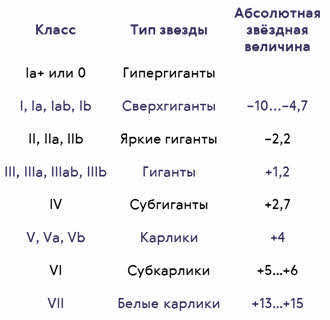
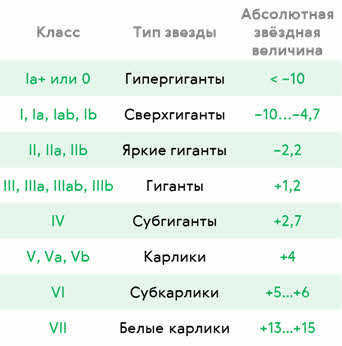
- Ia+ or 0 – hypergiants
- I, Ia, Iab, Ib – supergiants.
- II, IIa, IIb – bright giants
- III, IIIa, IIIab, IIIb – giants
- IV – subgiants
- V, Va, Vb – dwarfs (main sequence stars)
- VI – subdwarfs
- VII – white dwarfs.
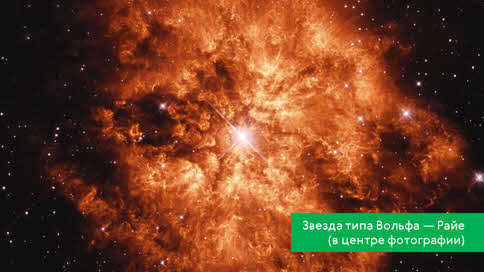
- W – Wolf-Rayet stars, which are extremely bright and heavy stars with temperatures around 70000 K and show intense emission lines in their spectra.
- L – stars or brown dwarfs with temperatures ranging from 1500 to 2000 K and containing metal compounds in their atmospheres.
- T – methane brown dwarfs with temperatures ranging from 700 to 1500 K.
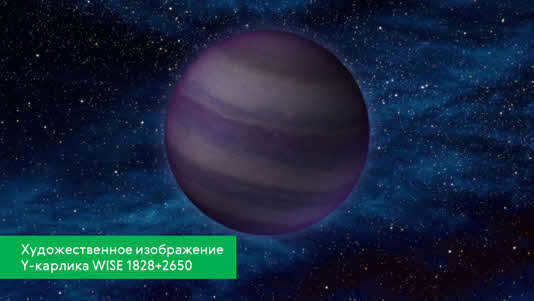
- Y – extremely cold (possibly methane-ammonia) brown dwarfs with temperatures below 700 K.
- C – carbon stars, which are carbon-rich giants. They were previously classified as R and N.
- S – zirconium stars
- D – white dwarfs
- Q – new stars
- P – planetary nebulae
- d – dwarf (main-sequence star)
- esd – extreme subdwarfs
- g – giant
- sd – subdwarf
- w or wd – white dwarf
- c – deep narrow lines
- comp – composite spectrum
- con – absence of visible absorption lines
- e – emission (hydrogen emission in O stars)
- em – emission in metal lines
- ep – peculiar emission (lines with a different character from the normal class)
- er – explicitly reversed emission lines
- eq – emission with absorption at shorter wavelengths
- ev – Variability applies only to emission lines
- ew – emission lines typical for stars of class W
- f, (f), ((f)) – helium and neon emissions in O stars
- h – WR-class stars with hydrogen emission lines
- ha – WR-class stars exhibiting hydrogen absorption and emission lines
- k – interstellar spectral lines
- m – prominent lines of metallic elements
- n – diffuse lines caused by rapid rotation
- neb – composite spectrum from a nebula
- nn – greatly blurred diffuse lines
- p – peculiar spectrum with irregularities
- pq – spectrum resembling that of a newly formed star
- s – sharp and narrow spectral lines
- sh – envelope spectrum
- ss – very narrow spectral lines
- v or var – spectral changes not related to orbital motion or pulsation
- w or wk or wl – faint spectral lines
- In English: Oh Be AFine Girl, Kiss Me Right Now Sweetheart (there are many variations of this sequence here)
- In Russian: Оone Бrity АEnglishman Фínics ЖEval Кac Мorkov;
- A variant that alludes to Boris Alexandrovich Vorontsov-Veliaminov: О, Бoris Аlexandrovich Фclinics Жeval Кac Мorkov;
- A modification that includes classes W, R, N, S: ВImagine: Оne Бribbed АEnglishman Фínics ЖEval Кac Мorkov – РHaven’t you? Нo Sure;
- Oh, Berris. Alexandrovich! Fphysicists Zhwaiting Khenceforth Mteachings (also meaning Boris Alexandrovich Vorontsov-Vel’yaminov).
- Another version by O. N. Vostryakova: “Both Pharaohs Give Kas Mthey can.
- Version by Sh. T. Habibullin: OhBe God, AFGHANISTAN. Kblow Mwe Ndon’t. This mnemonic was created long before the war in Afghanistan (1966-1967, possibly even earlier) [source not indicated for 791 days].
- ↑Pietro Angelo Secchi.Research on the analysis of starlight (French) // Weekly reports of the sessions of the Academy of Sciences. – July-December 1866. – Vol. 63. – P. 364-368. (Verified on October 21, 2009)
- ↑Pietro Angelo Secchi.New findings regarding the spectral analysis of starlight (French) // Weekly reports of the sessions of the Academy of Sciences. – July-December 1866. – Vol. 63. – P. 621-628. (Verified on October 21, 2009)
- ↑J. B. Hearnshaw. The examination of starlight: One hundred and fifty years of astronomical spectroscopy. – Cambridge University Press, 1987. – P. 62-63. – ISBN 0-521-25548-1, ISBN 978-0-521-25548-6.
- ↑J. B. Hearnshaw. – 1987. – P. 62-63.
- ↑ 12James B. Kaler .Stars and their spectra: a comprehensive guide to understanding the spectral sequence . – Published by Cambridge University Press in 1997. – Pages 62-63. – Contains 300 pages. – ISBN 0-521-58570-8, ISBN 978-0-521-58570-5 . (Last accessed on October 21, 2009)
- ↑Stephen Gottesman .A brief history of stellar spectra ( February 4, 2004 ). Archived from the original source on August 24, 2011. (Last accessed on October 21, 2009).
- ↑ The Guinness book of astronomy facts & feats, written by Patrick Moore in 1992, with ISBN 0-900424-76-1
- ↑The Color of Stars. Australia Telescope Outreach and Education (December 21, 2004). Archived from the original source on August 24, 2011.Last accessed on September 26, 2007. – Provides an explanation for the variation in color perception.
- ↑ 1234 LeDrew, G.; The Real Starry Sky, Journal of the Royal Astronomical Society of Canada, Vol. 95, No. 1 (whole No. 686, February 2001), pp. 32-33. Note: There is an error in Table 2, where the total number of stars is incorrectly listed as 824,00025. The correct numbers are 800 for main-sequence stars, 200 for white dwarfs, and 6.3 for giant stars.
- ↑ Sun // Physics of Space / edited by R. A. Syunyaev. – 2nd ed. – M .: Soviet Encyclopedia, 1986. – С. 37.
- I – supergiants
- II – bright giants
- III – giants
- IV – subgiants
- VI – subdwarfs
- VII – white dwarfs
- W – Wolf-Rayet stars, which are extremely bright and heavy stars with temperatures around 70000 K and exhibit intense emission lines in their spectra.
- L and T are brown dwarfs, which are objects that lie between stars and planets in terms of their characteristics. They have temperatures of about 1500-2000 K and 1000 K, respectively.
- C – carbon stars, which are giant stars with a high carbon content.
- S – zirconium stars.
- D – white dwarfs.
In a later development, Eduard Pickering made a modification to the definition of Class V. He divided it into two subcategories – hot stars with emission lines of helium, carbon, and nitrogen (known as Wolf-Rayet stars) and planetary nebulae [6].
For a long time, the classification system proposed by Secchi was widely accepted. However, in the late 1890s, it began to be gradually replaced by the Harvard classification system, which became dominant by the middle of the 20th century. The Harvard system will be described in more detail below [6] [7].
Introduction to the Basic (Harvard) Spectral Classification
The Basic (Harvard) Spectral Classification, which was developed at the Harvard Observatory during the period of 1890-1924, is a classification system that categorizes stars based on their temperatures. This classification is determined by analyzing the type and intensity of the absorption and emission lines present in the stellar spectra.
| 30 000—60 000 | blue | blue | 60 | 15 | 1 400 000 | weak | ~0,00003034 | – | |
| 10 000—30 000 | blue-white | blue-white and white | 18 | 7 | 20 000 | medium | 0,1214 | 21,8750 | – |
| 7500—10 000 | white | 3,1 | 2,1 | 80 | strong | 0,6068 | 34,7222 | – | |
| 6000—7500 | yellow-white | white | 1,7 | 1,3 | 6 | medium | 3,03398 | 17,3611 | 7,8740 |
| 5000—6000 | yellow | 1,1 | 1,2 | weak | 7,6456 | 17,3611 | 25,1969 | ||
| 3500—5000 | orange | yellowish orange | 0,8 | 0,9 | 0,4 | very weak | 12,1359 | 8,6806 | 62,9921 |
| 2000—3500 | red | orange-red | 0,3 | 0,4 | 0,04 | very weak | 76,4563 | – | 3,9370 |
Within a category, stars are divided into subcategories ranging from 0 (hottest) to 9 (coolest). The Sun belongs to the spectral category G2 and has a corresponding photospheric temperature of 5780 K [11] .
Yerkes luminosity-based classification (LBC)
Another factor that influences the type of spectrum is the density of the outer layers of the star, which is dependent on its mass and density, and ultimately on its luminosity. SrII, BaII, FeII, and TiII are particularly affected by luminosity, resulting in variations in the spectra of giant stars and dwarfs within the same Harvard spectral categories.
The Yerkes classification, developed at the Yerkes Observatory by W. Morgan, F. Keenan, F. Keehan, and M. Keegan, reflects the correlation between the type of spectrum and luminosity. This classification, also known as ICC after the initials of its authors, assigns stars the Harvard spectral class and luminosity class:
If the Hertzsprung-Russell diagram determines the x-axis, then the Yerkes classification determines the star’s position on this diagram. The Yerkes classification also allows for estimating a star’s luminosity and distance using its spectrum and apparent magnitude (spectral parallax method).
The Sun, known as a yellow dwarf, falls under the Yerkes spectral class G2V.
Additional spectral classifications
There are also other spectral classifications for certain categories of celestial objects:
Distinctive characteristics within the class
Several objects may display additional attributes within their spectrum. In order to denote these attributes, supplementary prefixes and postfixes are appended to the designation.
The supplementary prefixes preceding the spectrum designation include
Additive indices following the spectral designation
Mnemonics
There are various mnemonic formulas available for memorizing the basic sequence of the Harvard classification:
Notes

During this instructional video, we will discuss the categorization of stars based on their spectral characteristics. We will explore the correlation between a star’s temperature and its color. Additionally, we will become acquainted with the Doppler effect and its relevance in the field of astronomy. Lastly, we will examine the spectrum-luminosity diagram, which provides valuable information about stars.
Currently, you are not able to watch or share the instructional video with your students
In order to access this and other instructional videos in the package, you will need to add it to your personal account.
Unlock amazing possibilities


Outline for the lesson on “Stars: Spectra, Color, and Temperature. Spectrum-Luminosity Diagram”
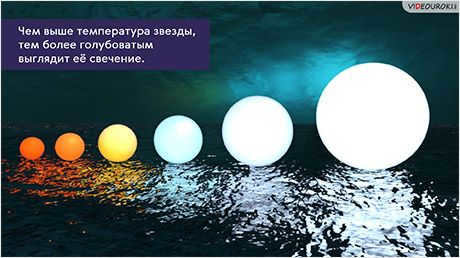
In our previous discussion, we learned that all the information we have about stars comes from the radiation they emit. Just like our Sun, stars emit light because their outer layers are heated to extremely high temperatures, reaching thousands of degrees Kelvin. This emission of light is similar to that of a heated object, such as the filament in an electric lamp. The color of the light emitted by a star depends on its temperature, with higher temperatures resulting in a whiter light.
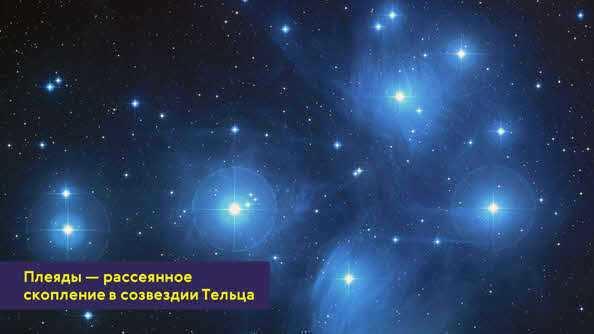
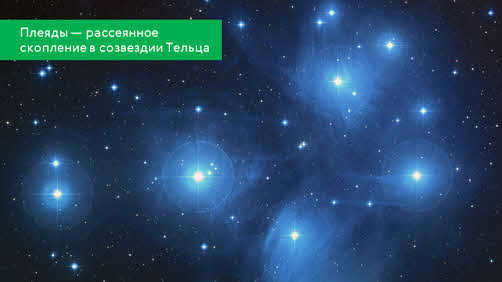
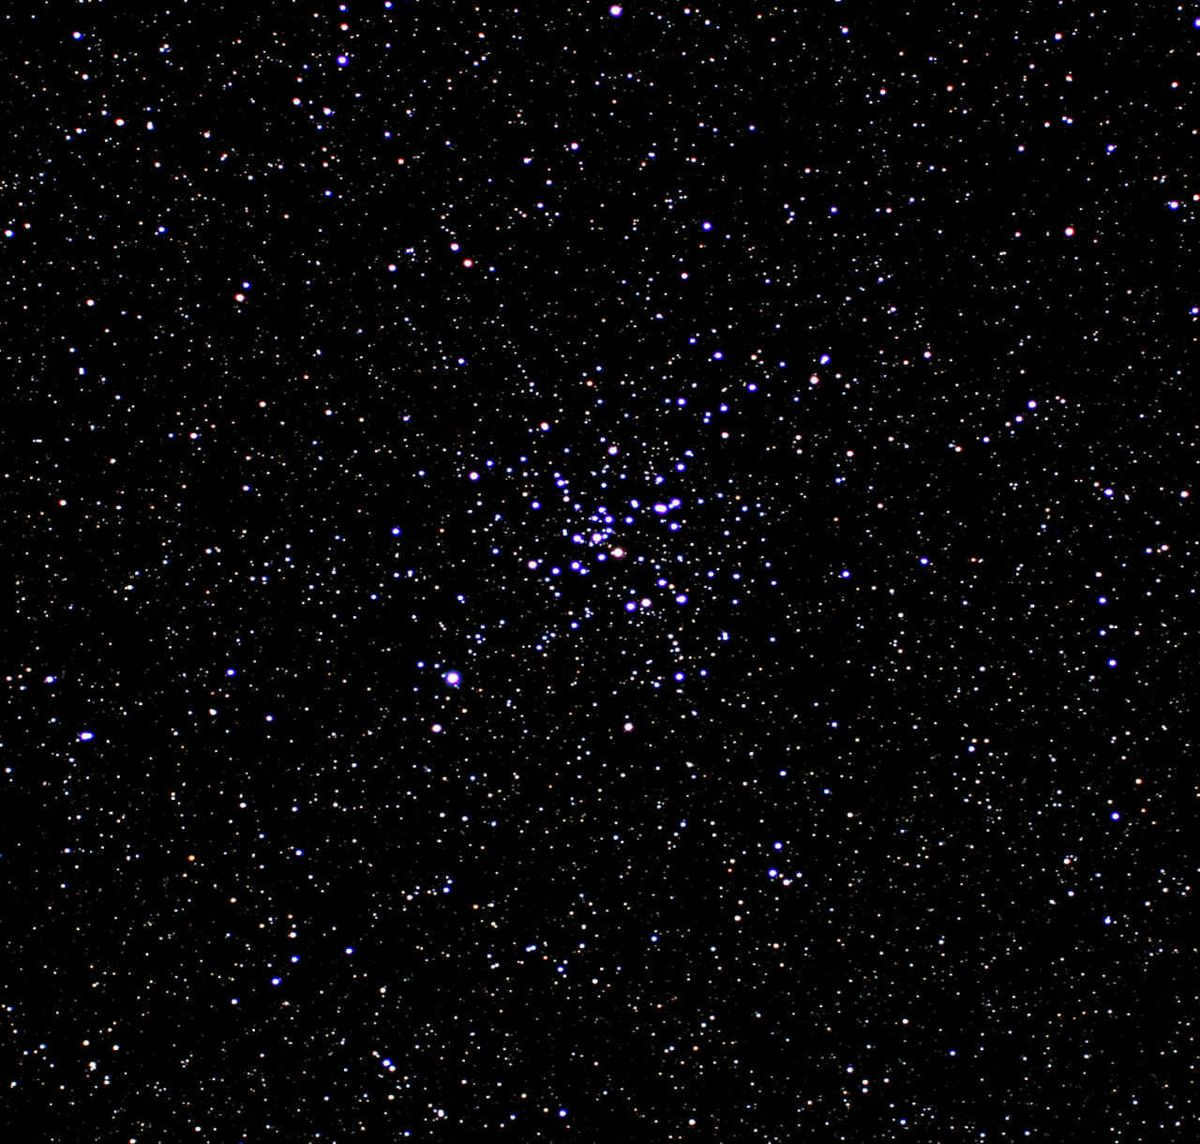
The same principle applies to the radiation of stars. Stars with higher temperatures appear bluer in color, like the Pleiades, a star cluster in the constellation Taurus, which has a diffuse bluish glow.
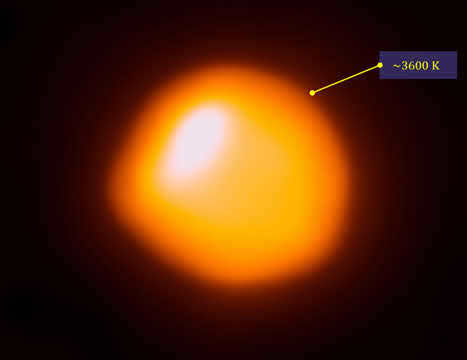
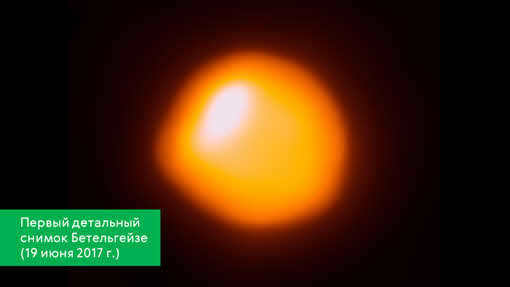
On the other hand, stars that are cool in temperature appear red to our eyes. This phenomenon is evident in the case of a massive star like Betelgeuse (alpha Orion).
However, a comprehensive understanding of this relationship is provided through the examination of stellar spectra. The primary variations in the spectra of stars can be found in the quantity and intensity of the observed spectral lines (particularly absorption lines), as well as in the distribution of energy across the continuous spectrum.
In 1893, German scientist Wilhelm Wien discovered that the wavelength at which the peak radiation occurs depends on the temperature of the emitting body. As the temperature rises, the position of the peak shifts towards the shorter-wavelength portion of the spectrum. The wavelength corresponding to the peak in the energy distribution is connected to the absolute temperature through a relationship known as Wien’s law of displacement:
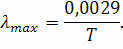
By utilizing this law, we can ascertain the temperature of a star provided that the wavelength at which the intensity of radiation peaks in its spectrum is 230 nm.
Research on different kinds of stars has revealed that the majority of them have temperatures ranging from 2000 to 60,000 Kelvin. It has also been discovered that temperature variations affect the state of atoms and molecules in star atmospheres, which is manifested in their spectra. By analyzing the types and intensities of spectral lines, scientists have developed a method known as spectral classification of stars.
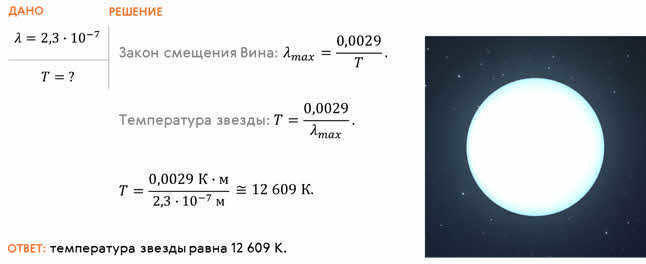
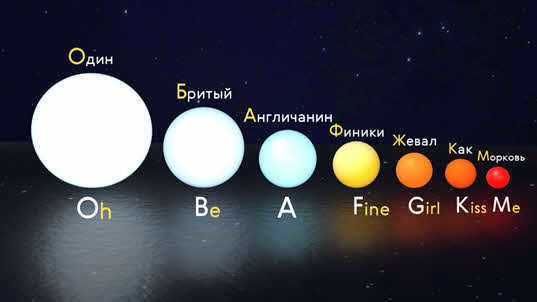
The modern system of spectral classification of stars was established in the 20th century at the Harvard Observatory in the United States. In this system, spectral types are assigned using capital letters of the Latin alphabet, starting with the highest temperature and proceeding in descending order:
In order to commit this sequence to memory, astronomers devised a mnemonic rule. In its original form, it goes like this: Oh, Be A Fine Girl, Kiss Me. The Russian equivalent variant is as follows: Оone Бribbed АEnglishman Фínics ЖEval Кac Мorcovy.
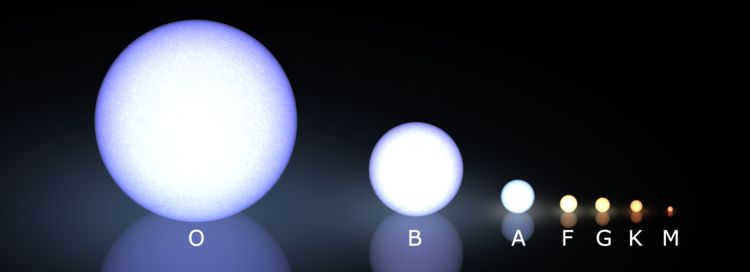
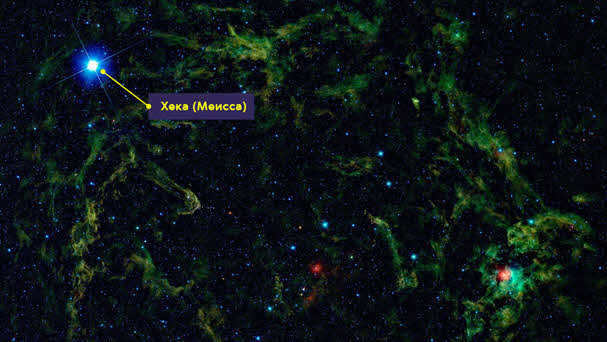
Let’s delve a little deeper into each class. Now, the stars that fall into the class O category are extremely hot, with temperatures ranging from 30,000-60,000 K. At such high temperatures, the highest intensity of radiation is in the ultraviolet region of the spectrum. Therefore, these stars have a distinct blue hue. A typical example of this class is Heck’s Lambda Orion.
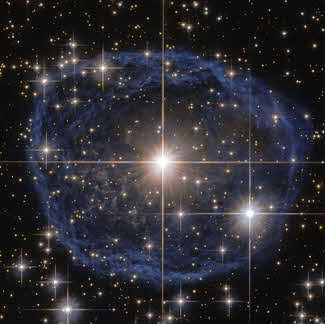
Stars in the B class have temperatures ranging from 10-30 thousand K and display a bluish-white hue. A well-known example of this class is the star Spica, located in the Virgo constellation.
Stars in class A are characterized by their white color and surface temperatures ranging from 7,500 to 10,000 K. Notable stars belonging to this class include Vega and Sirius.
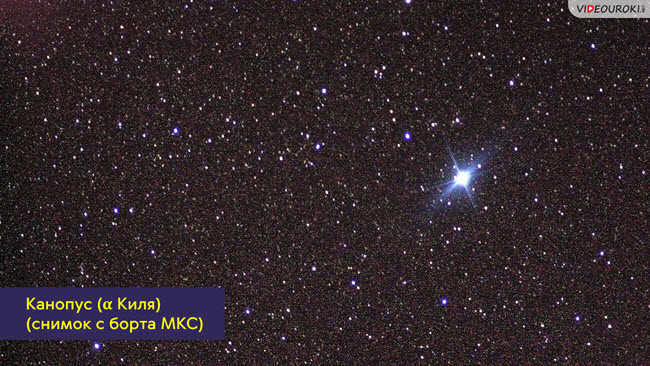
Class F stars have temperatures between 6,000 and 7,500 K, giving them a yellow-white appearance. Canopus, found in the Kiel constellation, is a typical representative of this class.
Stars with surface temperatures ranging from 5000 to 6000 K are classified as G-class stars. Our Sun is a well-known example of this class.
Class K stars have an orange color and their surface temperature ranges from 3500-5000 K. This class includes stars like Arcturus in the Volopassus constellation and Aldebaran in Taurus.
Lastly, there is the M class which consists of cold stars with a minimum temperature ranging from 2000-3500 K. These stars have a bright red or sometimes dark orange color. Betelgeuse, a famous star in the Orion constellation, belongs to this class.
As the methods of observing stars and analyzing their spectra advanced, the Harvard spectral classification system was enhanced and broadened. For instance, the letter Q was employed to indicate the spectral classes of recently formed stars. The spectra of planetary nebulae were categorized as class P. Additionally, the letter W or WR started to be used to designate the spectra of Wolf-Rayet type stars – these stars are extremely hot, with temperatures surpassing those of O class stars and reaching up to 100,000 K.
In 1995, the discovery of brown dwarfs, which are stars with a temperature below 2000 K, led to the creation of new spectral classes. These classes, known as L, T, and Y, were introduced. The Y class is the most recent addition to the spectral classification system, having been established in August 2011.
Ultracold brown dwarfs are included in the classification, with a temperature ranging from 300-500 K.
Further subdivisions are made within each class to account for subtle differences, resulting in 10 subclasses ranging from 0 (hottest) to 9 (coldest). The spectral class O is an exception, as it is divided into fewer subclasses, specifically from 4 to 9.5. For instance, our Sun belongs to the G2 spectral class.
By measuring the position of spectral lines, valuable information about the chemical composition of stars can be obtained, as well as their velocity.
As far back as 1842, Christian Doppler discovered that the movement of a wave source causes a change in frequency and subsequently wavelength of the radiation perceived by an observer. This observation was made while studying water waves.
Let’s illustrate this concept with a simple scenario. Imagine you are waiting for a bus at a bus stop. In the distance, you hear the sound of a siren, like that of an ambulance. As the siren approaches you, the frequency of the sound waves it emits will increase. Consequently, you will perceive a higher pitch. This phenomenon occurs because the siren has covered some distance from you while emitting one wave crest. As a result, each subsequent crest of the wave originates from a closer location, and the waves reach your ears at a higher frequency. However, when the car passes by you closely, you will hear the actual tone emitted by the siren. As the car moves farther away, the siren’s tone will become lower due to the decreasing frequency of the sound waves.
The phenomenon known as the Doppler effect is described by a formula that expresses the relationship between the difference in wavelength and the velocity of the source along the line of sight, relative to the speed of light.
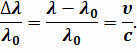
The wavelength of the spectral line for a stationary source is denoted as λ, while λ’ represents the wavelength in the spectrum of a moving source. The velocity of the source (in this case, a star) is represented by v, and c denotes the speed of light in a vacuum.
Another factor that affects the type of star’s spectrum is its luminosity, which is not considered in the Harvard classification. However, variations in luminosities result in differences in the spectra of giant and dwarf stars within the same Harvard spectral classes. To address this, the Yerkes Observatory introduced the Yerkes Classification in 1943, also known as the ICC, named after the initials of the scientists involved: William Morgan, Philip Keenan, and Edith Kellman.
Considering the two classifications, our Sun possesses a G2V spectral class.
To sum up, it is worth noting that in the early 20th century, American astronomer Norris Russell and Danish astronomer Einar Herzsprung independently discovered a correlation between spectral type and stellar luminosity. They posed the question, “What if we were to arrange the stars on a coordinate system where their position on the vertical axis corresponds to their luminosity (or absolute stellar magnitude) and their position on the horizontal axis corresponds to their temperature (spectral class)?”
If the stars were uniformly distributed throughout the system, there would be no room for discovery. However, any deviation from this order would reveal a pattern in the arrangement of the celestial bodies, providing explanations for numerous mysteries. This is precisely what occurred. By observing the growth of a star’s luminosity in the Y direction and its temperature in the X direction, distinct groups of stars – referred to as sequences – emerge.
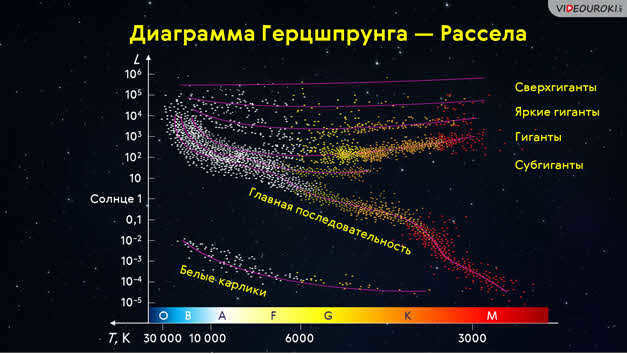
The Main Sequence, which runs diagonally from the top left to the bottom right, represents the majority of stars in the Universe, including our own Sun. These are ordinary dwarf stars that make up about 90% of all the stars.
In the top right corner of the diagram, there is a group of stars known as red giants. These stars are very bright but have a relatively low temperature, which gives them their red color.
Located at the top of the chart is a sequence of supergiants. These stars have incredibly high luminosity, low density, and diameters that are tens or hundreds of times larger than the Sun.
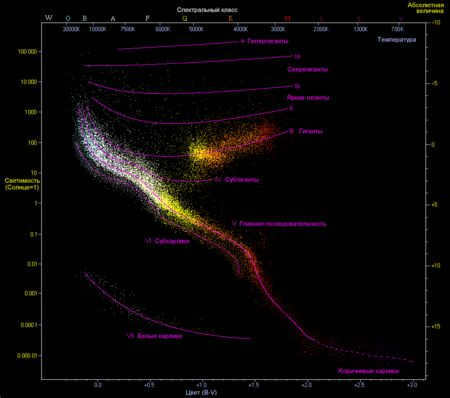
The diagram that is produced is known as a spectrum-luminosity diagram or the Hertzsprung-Russell diagram.
We suggest that you memorize this diagram. It is not difficult to comprehend, but it holds great significance in the progression of stars.
Within this lecture, we will discuss the categorization of stars according to their spectral properties. We will explore the correlation between a star’s temperature and its color. Additionally, we will acquaint ourselves with the diagram that illustrates the relationship between a star’s spectrum and its luminosity. Furthermore, we will recall the fundamental source of energy for both the sun and other stars.
Currently, you are not able to watch or share the instructional video with your students
In order to view this and other video lessons included in the package, you must first add it to your personal account.
Unlock amazing functionalities
Outline of the Lesson “Fundamental Characteristics of Stars”
In a previous lesson, we discussed how all the information we gather about stars is based solely on the radiation they emit. Just like our Sun, all stars emit light because their outer layers are extremely hot, reaching temperatures in the thousands of degrees. The emission of light from a star is similar to that of a heated object, such as the filament in an electric lamp. The light emitted by the filament becomes whiter as its temperature increases. This same principle applies to the radiation emitted by stars: the higher the temperature of a star, the bluer its glow appears (as seen, for instance, in the Pleiades, a scattered star cluster located in the constellation of Taurus).
On the other hand, we perceive cool stars as having a reddish hue. This concept is effectively demonstrated by the immense star known as Betelgeuse. Its temperature measures approximately 3600 K.
Research on various categories of stars has demonstrated that their temperatures range from 2000 to 60,000 K. Additionally, it has been discovered that changes in temperature affect the state of atoms and molecules in a star’s atmosphere, which is evident in their spectra. The spectral classification of stars is based on the types of spectral lines and their intensities.
The modern spectral classification of stars was established in the 1920s at the Harvard Observatory in the United States. In this classification system, spectral types are typically represented by capital letters of the Latin alphabet in descending order of temperature: O, B, A, F, G, K, M.
Class O stars are characterized by their high temperature, ranging from 30,000 to 60,000 K. Due to this extreme heat, these stars emit the most intense radiation in the ultraviolet region of the spectrum. As a result, they have a distinct blue color. One example of a Class O star is Bellatrix, located in the Orion constellation.
Stars in Class B have temperatures ranging from 10,000 to 30,000 K. They appear bluish-white in color. An example of a Class B star is Regulus, found in the Leo constellation.
Class A stars are white in color and have surface temperatures ranging from 7,500 to 10,000 K. Sirius, the brightest star in the night sky, is a typical representative of this class.
Stars with temperatures of 6000-7500 K belong to class F. They have a yellow-white color. An example of a star in this class is Altair in the constellation Eagle.
Class G consists of yellow stars with a surface temperature of 5000-6000 K. The Sun is a well-known representative of this class.
Stars belonging to class K have an orange color and a surface temperature of 3500-5000 K. Aldebaran in the constellation Taurus belongs to this class of stars.
And finally, there is class M. In this class, there are cold stars with a minimum temperature of 2000-3500 K. They have a bright red or sometimes dark orange color. Betelgeuse, a red supergiant in the constellation Orion, is an example.
With the improvement of methods for observing stars and their spectra, the Harvard spectral classification system was expanded and enhanced. Consequently, astronomers started to assign extra spectral classes to specific types of celestial objects. For instance, the letter Q was introduced to represent the spectral classes of new (young) stars. The spectra of planetary nebulae were categorized as class P. Additionally, the letter W was used to indicate the spectra of Wolf-Rayet stars – these are extremely massive and hot stars, with temperatures surpassing those of O-class stars and reaching 100,000 K.
Additionally, there exist distinct categories of stars known as carbon stars (C class), zirconium stars (S class), and white dwarfs (D class).
In 1995, a groundbreaking discovery was made: the identification of stars with temperatures below 2,000 K, now known as brown dwarfs. This discovery led to the establishment of the spectral classes L, T, and Y. The Y class, the most recent addition, was introduced in August 2011 and encompasses ultracold brown dwarfs with surface temperatures ranging from 300-500 K.
There are 10 subclasses within each class that have subtle differences. These subclasses range from 0 (hottest) to 9 (coldest). The spectral class O is an exception with fewer subclasses, ranging from 4 to 9.5. For instance, our Sun falls into the G2 spectral class.
An additional factor that determines the spectrum of a star is its luminosity, which is not considered in the Harvard classification. However, differences in luminosity can result in variations in the spectra of giant and dwarf stars within the same Harvard spectral classes. To address this, the Yerkes Observatory developed another classification called ICC in 1943, which takes into account the luminosities of stars. Based on both classifications, our Sun has a spectral class of G2V.
In the early 1900s, two astronomers, Norris Russell from the United States and Einar Hertzsprung from Denmark, made separate and independent discoveries about the relationship between the type of spectrum and the brightness of stars. They found that when plotting the brightness of stars on the y-axis and their temperatures on the x-axis, the stars form distinct groups known as sequences.
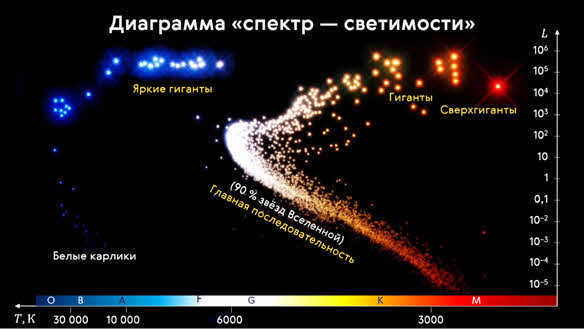
In the center, spanning from the top left to the bottom right, lies the primary sequence – a succession of typical, diminutive stars that constitute roughly 90% of all celestial bodies in the cosmos. It is also the home of our very own Sun.
Located in the upper right corner are stars that emit intense light, yet possess relatively low temperatures in their photospheres (evidenced by their crimson hue). These stars form a lineup of scarlet giants.
Occupying the pinnacle of the diagram is the supergiant sequence. These stars boast extraordinary luminosity, sparse density, and dimensions tens to hundreds of times grander than that of the Sun.
Beneath the primary sequence, we find scorching stars with feeble luminosity. This is a progression of white dwarfs. They possess dimensions comparable to that of Earth and have masses similar to the Sun.
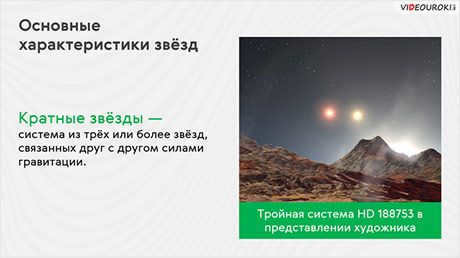
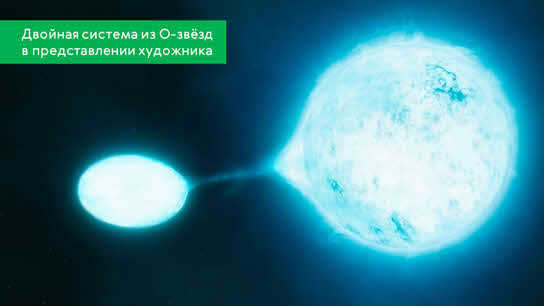
As astrophysics advanced, it was discovered that stars differed in more ways than just their color and temperature. Observations have revealed that many stars form pairs or are part of complex systems. In fact, approximately half of all stars in our Galaxy are part of binary systems.
Binary stars are star pairs that are in close proximity to each other.
Among the stars that appear next to each other in the sky, we can distinguish between optical doubles and physical double stars. In the case of optical doubles, two stars are projected next to each other on the celestial sphere, even though their actual distance may be millions of light years apart.
Physical double stars, on the other hand, are truly located next to each other in space. They are not only bound together by gravitational forces, but they also orbit around a shared center of mass.
Observations of binary stars and calculations of their masses for various types have revealed the following:
– The masses of stars range from 0.03 to 60 times that of the Sun. The majority of stars fall within the range of 0.4 to 3 solar masses;
– There exists a relationship between the masses of stars and their luminosities, allowing for the estimation of the masses of individual stars. For stars with masses between 0.5 and 10 solar masses, the luminosity is proportional to the 4th power of the mass. For stars with masses greater than 10 solar masses, the luminosity is proportional to the 2nd power of the mass.
Now let us ponder a query: from whence do stars, including our very own Sun, derive their energy for countless millions and billions of years? This inquiry has plagued scientists for decades (and even a century). In an attempt to address it, some truly extraordinary conjectures have been posited. One such proposal came from William Herschel, who theorized that the Sun is a frigid and compact entity encased within an immense inferno. However, there lies an issue, as this inferno would surely deplete entirely within a mere few thousand years of ignition.
It wasn't until the 1930s that the idea was proposed by Hans Albrecht Bethe, an American astrophysicist, that the energy of the Sun is obtained from thermonuclear reactions happening in its interior. Additionally, Bethe also made the groundbreaking discovery of the hydrogen (or proton-proton) cycle, which is a sequence of three thermonuclear reactions that result in the creation of helium from hydrogen.
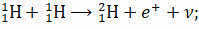
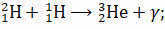
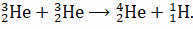
Take note that the initial two reactions must occur twice in order to create the two nuclei required for the third reaction.
To comprehend the immense amount of energy emitted by the Sun due to the conversion of hydrogen to helium, it is sufficient to understand that, on average, it loses approximately 4 million tons of hydrogen every second! At first glance, this may seem like an astronomical amount. However, it is minuscule when compared to the overall mass of the Sun. And the calculations made by experts indicate that the “fuel” within its core is sufficient to sustain thermonuclear reactions for approximately 5 billion years. Following that, irreversible reactions will commence within the Sun’s core, ultimately leading to its demise.
What is the definition of a spectral class?
A spectral class is a categorization system for stars, where celestial bodies are grouped based on the temperature of their photosphere. The variation in stellar spectra can be attributed to the distinct physical properties of their atmospheres. Factors such as temperature, pressure, magnetic fields, electric fields, chemical composition, and rotation all contribute to determining the spectral class of a star.
A device used for obtaining and visually examining a spectrum is known as a spectroscope. If the spectrum’s color is recorded on a photographic plate, the device is referred to as a spectrograph. While observing the sun’s disk in the sky, German scientist Joseph Fraunhofer discovered the presence of thin black lines within its continuous spectrum. Shortly thereafter, Gustav Kirchhoff determined that any gas in a rarefied state is capable of absorbing light at specific wavelengths that it also emits. This groundbreaking discovery, along with the laws of physics, allowed experts to determine the chemical composition of the solar atmosphere, and the black lines were named absorption lines.
Currently, there are instruments that can measure the spectrum of stars across almost all ranges except for the optical range. This can be accomplished by simply changing the filters and eyepieces.
In the 19th century, specifically in the 1860s and 1870s, Angelo Secchi conducted extensive research on celestial bodies, resulting in the development of the very first spectral classification system for stars. Secchi organized the stars into three classes based on decreasing surface temperature, which was reflected in changes in the spectrum’s color. Additionally, in 1868, Secchi identified a new group of stars known as carbon stars.
Secchi’s spectral classification system remained in use until the late 1900s when it was replaced by the Harvard classification system, which is still employed today.
Over the course of several decades, the Harvard Observatory in the United States captured numerous photographs of celestial luminaries. By analyzing these images, scientists were able to establish a classification system for stellar spectra. From 1890 to 1924, Pickering and Cannon dedicated their efforts to this endeavor. Today, the Harvard spectral classification of stars is considered the primary classification system. It utilizes the letters O, B, A, F, G, K, and M to designate different spectral types. When this classification was initially developed, experts did not yet understand the relationship between spectrum and temperature parameters. As a result, the order of the spectral classes coincided with the alphabetical arrangement of the letters.
The temperature of a star determines its surface color, which then determines its spectral class. For instance, stars with the highest temperatures emit a blue glow and are classified as O and B stars. Our Sun, classified as a G2 star, emits a yellow color. On the other hand, the coldest stars emit a red glow and fall into the K and M classes.
There are also additional classes known as L and T. These classes are used to categorize brown dwarfs with varying temperature indices. However, these objects are so small, with a mass of about 0.1 times that of the Sun, that they are rarely observable. They emit very little visible light.
The classification of stars at Harvard is established using temperature values from the photosphere’s luminosity. Based on this, stars with the same temperature but varying levels of luminosity can fall into the same category. In order to provide a more precise organization of celestial bodies, scientists have devised an alternative classification system, known as the Yerkes spectral classification, which is based on luminosity. Luminosity classes are indicated by numbers ranging from 0 to VII, which are added after the star’s spectral class. The Sun, for instance, has a luminosity class of V, so it is denoted as G2V in the classification table (spectrum-luminosity). In certain cases, a subclass may be added to the primary class. For instance, Polaris has a spectral class of F7 and a luminosity class of Ib.
By the 20th century, astronomers had gathered a wealth of information about stars through their studies of outer space. At this point, there was a considerable understanding of the various types of stars, including their luminosity, distance, and temperature. The need to categorize and organize the observed stars in the universe became increasingly apparent. This task was successfully accomplished by two scientists who were living on different continents: Danish astronomer Einar Hertzsprung and American scientist Henry Russell. Interestingly, they independently created the same diagram, known today as the Hertzsprung-Russell (HR) diagram, without even being aware of each other’s work. The HR diagram is a graphical representation, with the vertical axis representing luminosity and the horizontal axis representing the surface temperature of the star.
The main sequence is populated by a significant number of closely packed objects. In this region, a star spends approximately 90% of its entire lifespan. The Sun, too, resides in the middle of this sequence.
All main sequence stars possess a hot, dense core. Within this core, hydrogen undergoes thermonuclear reactions, resulting in the conversion of hydrogen into helium. Once the process of hydrogen fusion ceases, the star’s tenure on the main sequence also concludes.
Following the main sequence, the next category of stars includes red giants and supergiants. These are highly luminous celestial bodies with considerable mass and luminosity. They are situated in the upper right portion of the diagram. Their temperatures range from 3000 to 5000 degrees Celsius. Red giants and supergiants represent the final stage in the life cycle of stars, occurring after the main sequence.
The discovery of Icarus, the most distant star on the main sequence, took place in 2018. It is located 9 billion light years away from our planet.
Stars prior to the main sequence
This category includes the youngest types of celestial bodies that can already be observed through an optical telescope. Pre-main-sequence stars can undergo thermonuclear reactions, but their intensity is so weak that the energy released is insufficient to compensate for the energy expended on luminosity. These stars are compressed and heated by their own gravitational forces, which is their primary characteristic distinguishing them from main-sequence stars.
In certain terms, pre-main-sequence stars are protostars in the final stages of formation.
The life cycle of a star is highly fascinating and enigmatic. Despite an abundance of knowledge, scientists still have numerous inquiries. In the modern era, novel techniques are being developed, apparatuses and instruments are being enhanced, which in the future will not only verify or revise the available information but also, conceivably, unveil unexplored celestial bodies.
1. How are distances to stars determined?
2. What determines a star’s color?
3. What is the primary factor contributing to the disparity in star spectra?
4. Upon what does a star’s luminosity hinge?
The temperature of stars is the main factor that differentiates their spectra. Blue stars are the hottest, while red stars are the coolest. As stars age and cool, their spectra undergo corresponding changes.
Since ancient times, scientists have been engaged in the study of stars. One of the questions that astronomers have asked is why stars emit different colors in their spectra. Some stars have red shades, while others have blue shades. For a long time, it was believed that the chemical composition of a star’s atmosphere influenced its visible spectrum. After all, each star has a unique combination of chemical elements in its atmosphere. However, modern science allows us to study celestial bodies, even those that are located far away from Earth. Through these studies, scientists have discovered that the chemical composition only indirectly affects the intensity of the spectrum. The main factor that determines the color of a star’s spectrum is its temperature. Stars with higher temperatures tend to have more blue shades in their spectra, while stars with lower temperatures emit a red color.
You have the option to log in or create an account in order to post a response and receive a bonus.
What are the differences between heart disease and neuralgia?
While it is advisable to seek medical advice when experiencing worrisome symptoms, there are certain indicators that can help differentiate between neuralgia (a less severe condition) and heart disease, which poses a significant threat to health. To learn more, continue reading.
At the moment, it is not possible for you to view or share the instructional video with your students
To gain access to this and other video lessons in the package, you must add it to your personal account by purchasing it from the catalog.
Unlock amazing possibilities
We have already discussed the fact that all the information we receive about stars is based on the radiation they emit. Like our Sun, all stars emit light because their outer layers are extremely hot and have temperatures that can reach thousands of degrees on the Kelvin scale. The process of a star emitting light is similar to that of a heated object, such as a filament in an electric lamp. The hotter the filament, the brighter the light it emits.
Similarly, the higher the temperature of a star, the bluer its light appears (as seen, for instance, in the Pleiades, a dispersed star cluster in the Taurus constellation).
On the other hand, to us, cool stars seem to have a reddish hue. This phenomenon is easily observed when looking at the colossal star Betelgeuse (alpha Orion) as an example.
However, the study of stellar spectra provides the most comprehensive understanding of this relationship. The observed spectral lines (especially absorption lines) and the distribution of energy in the continuous spectrum are the most significant differences in the spectra of stars.
In 1893, Wilhelm Wien, a German scientist, discovered that the temperature of the emitting body determines the wavelength at which the maximum radiation occurs. As the temperature increases, the maximum shifts towards the short-wave region of the spectrum. The wavelength corresponding to the maximum energy distribution is governed by Wien’s displacement law, which relates it to the absolute temperature.
By utilizing this law, we can calculate the temperature of a star provided that the peak intensity of its radiation spectrum is observed at a wavelength of 230 nm.
The research on various categories of stars has revealed that the majority of them have a temperature ranging from 2000 to 60,000 Kelvin. Additionally, it has been observed that alterations in temperature affect the state of atoms and molecules in star atmospheres, which is evident in their spectra. By considering the types of spectral lines and their intensity, a classification system for stars based on their spectra is established.
The contemporary spectral classification of stars was developed in the 20th century at the Harvard Observatory in the United States. In this system, spectral types are typically denoted by capital letters of the Latin alphabet in a sequence that corresponds to decreasing temperatures:
To commit this sequence to memory, astronomers devised a mnemonic rule. In its original form, it goes like this: Oh, Be A Fine Girl, Kiss Me. The Russian equivalent is: One Shaved Englishman Chewed Dates Like Carrots.
Now, let’s delve a bit deeper into each of the categories. Stars classified as class O are extremely hot, with temperatures ranging from 30,000 to 60,000 K. At such high temperatures, the majority of the radiation emitted falls within the ultraviolet range of the spectrum. As a result, these stars display a distinct blue tint. A prime example of a class O star is Heck’s Lambda Orion.
Class B consists of stars with temperatures ranging from 10,000 to 30,000 K, giving them a bluish-white hue. One well-known example of this class is the star Spica, situated in the Virgo constellation.
Stars that fall under class A are characterized by their white color and surface temperatures ranging from 7,500 to 10,000 K. The brightest stars in this category include Vega and Sirius.
Class F comprises stars with temperatures ranging from 6,000 to 7,500 K, resulting in a yellow-white color. Canopus, located in the Kiel constellation, serves as a typical representative of this class.
Stars with a surface temperature of 5000-6000 K are classified as class G, and they have a yellow color. Our Sun is a well-known example of a class G star.
Class K stars are orange in color and have a surface temperature in the range of 3500-5000 K. Some examples of class K stars include Arcturus in the constellation of Volopassus and Aldebaran in Taurus.
Lastly, class M stars are characterized by their cold temperatures, which range from 2000-3500 K. These stars have a bright red color, sometimes appearing dark orange. Betelgeuse, located in the constellation of Orion, is a famous example of a class M star.
Back in 1995, a groundbreaking discovery was made when stars with temperatures lower than 2000 K were identified – giving birth to a whole new class of celestial objects known as brown dwarfs. As a result, the spectral classes L, T, and Y were established. It is worth noting that the most recent addition to this classification, class Y, was only introduced in August 2011.
There are ultracold brown dwarfs included in the classification, with a temperature ranging from 300-500 K.
Further divisions are made within each class to account for subtle differences, resulting in 10 subclasses ranging from 0 (hottest) to 9 (coldest). Spectral class O is an exception, with fewer subclasses ranging from 4 to 9.5. For instance, our Sun belongs to spectral class G2.
By measuring the position of spectral lines, we not only gain information about the chemical composition of stars but also determine their motion speed.
As far back as 1842, Christian Doppler made an observation on water waves, discovering that the motion of the wave source causes a change in frequency and, consequently, in the wavelength of the radiation perceived by the observer.
Let me illustrate this concept with a simple illustration. Picture yourself waiting at a bus stop, anticipating the arrival of a bus. Suddenly, in the distance, you catch the faint sound of a siren, like that of an ambulance. As the siren draws nearer, the frequency of the sound waves emitted by it will intensify. Consequently, the pitch that reaches your ears will be higher. This occurs because the siren has covered some distance away from you while emitting one wave peak before producing the next one. As a result, the source of each subsequent wave peak is closer to you, causing the waves to reach your ears more frequently. Once the vehicle passes by you, the true tone of the siren becomes audible. However, as the car moves further away, the siren’s tone gradually decreases due to the diminishing frequency of the sound waves.
The Doppler effect refers to the phenomenon whereby the variation in wavelength between the speed of the source along the line of sight and the speed of light can be mathematically expressed using a formula.
In this equation, λ represents the wavelength of the spectral line emitted by a stationary source, while Δλ represents the wavelength shift observed in the spectrum of a moving source. V is the velocity of the source (in this case, a star), and c is the speed of light in a vacuum.
Another factor that influences the type of spectrum exhibited by a star is its luminosity, which is not accounted for in the Harvard classification. Although stars of the same Harvard spectral class may have similar spectra, differences in their luminosities can lead to variations in the spectra of giant and dwarf stars. To address this, the Yerkes Observatory introduced the Yerkes classification in 1943, which incorporates the luminosity of stars. This classification is also known as the ICC, named after the first letters of the last names of the scientists involved: William Morgan, Philip Keenan, and Edith Kellman.
Taking into consideration the two classifications, our Sun is classified as a G2V star.
In the event that the stars were uniformly distributed throughout the system, there would be no significant findings. However, any deviation from this order would reveal a discernible pattern in the arrangement of these celestial bodies, thereby providing explanations for numerous mysteries. And indeed, this turned out to be the case. If we plot the luminosity of a star along the Y-axis (with increasing values from bottom to top) and the temperature along the X-axis (with increasing values from right to left), we can clearly identify distinct groups or sequences within the stars.
Stretching across the middle, from the top left to the bottom right corner, lies the Main Sequence, a lineup of ordinary dwarf stars that account for approximately 90% of all the stars in the Universe. Our Sun is also located within this sequence.
In the top right corner, you’ll find stars that shine brilliantly, but possess a relatively low temperature in their photosphere, which is represented by their red hue. These stars form a sequence known as red giants.
Occupying the highest position on the diagram is a sequence of supergiants. These stars boast immense luminosity, low density, and diameters that are tens and hundreds of times larger than that of the Sun.
Below the main sequence, you’ll find hot stars with faint luminosity. This is referred to as the sequence of white dwarfs. These stars have sizes comparable to the Earth and masses that are similar to that of the Sun.
Differences in the color of stars
The variation in the coloration of stars can be attributed to their varying temperatures. This is the main contributing factor. Light is a form of wave radiation, with its wavelength being the distance between the crests of each wave. The wavelengths of light are incredibly short. To put it into perspective, imagine dividing an inch into 250,000 equal parts (1 inch is equivalent to 2.54 centimeters). Only a small fraction of these parts would make up the length of a single light wavelength.

Despite the extremely small wavelength of light, even the slightest variation in the size of light waves can have a significant impact on the perceived color of an image. This is due to the fact that different wavelengths of light are interpreted by our eyes as different colors. For instance, the wavelength of red light is one and a half times longer than that of blue light. When combined, light waves of various wavelengths create white light, which is composed of photons of different colors.
Through our daily experiences, we understand that the color of objects is influenced by their temperature. If we were to place an iron poker in a fire, it would gradually change color as it becomes hotter. Initially, it would turn red, then become even more intensely red. If the poker continued to heat up without melting, it would transition from red to orange, then yellow, and eventually reach a white color. At its hottest point, it would appear as a blue-white hue.
Physical laws governing the relationship between color and temperature
Researchers have established fundamental physical laws that establish a connection between color and temperature. As a body’s temperature increases, its surface emits a greater amount of energy and produces shorter wavelengths. In comparison, the color blue possesses a shorter wavelength than red. Consequently, a body that emits light in the blue wavelength range is hotter than a body emitting red light. When stars’ glowing gas atoms emit photons, these particles carry an energy level that is directly proportional to the gas’s temperature, resulting in a shorter wavelength for higher temperatures.

This is why stars that are newly formed and very hot emit light in the blue-white range. As stars age and use up their nuclear fuel, they gradually cool down. Consequently, older stars that are in the process of cooling emit light in the red spectrum. Middle-aged stars, such as our Sun, emit light in the yellow range.
Our Sun is located 149 million kilometers away from Earth, which allows us to clearly observe its color. However, other stars are trillions of kilometers or even farther away from us. Even with the use of powerful telescopes, it is impossible to determine their color with certainty. In order to determine the color of distant stars, scientists utilize a special device called a spectrograph. This instrument allows them to analyze the spectral composition of starlight and unveil its true color.
Astronomers can determine a star’s color by analyzing the most intense radiation in its spectrum. By using simple mathematical equations, they can then calculate the star’s surface temperature. This temperature can provide insights into the star’s age.
Watch this fascinating video on star colors
If you come across any errors, please highlight the text and press Ctrl+Enter.
Spectral classes categorize stars based on their emission spectrum, particularly the temperature of their photosphere.
Primary (Harvard) spectral categorization
The modern (Harvard) spectral categorization of celestial bodies, originated at the Harvard Observatory during the period of 1890-1924, is a temperature-based classification that relies on the kind and proportional strengths of absorption and emission lines in the stellar spectra.
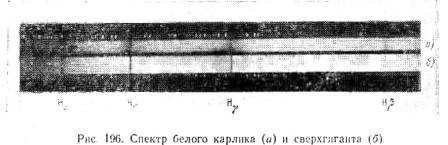
The strengths of clusters of lines in the stellar spectra of diverse spectral classifications.
The Hertzsprung-Russell diagram, also known as the spectral class-luminosity diagram, provides a visual representation of the basic (Harvard) spectral classification of stars.
Stars are classified into subclasses based on their temperature, with class 0 being the hottest and class 9 being the coolest. The Sun falls into the G2 spectral class and has a photospheric temperature of 5780 K.
There are mnemonics available to help remember the sequence of subclasses. In English, one example is: Oh Be AFine Girl, Kiss Me Right Now Sweetheart (Not all classes are listed above). There are various variations of this sequence that can be found [1].
In Russian, the mnemonic is: One Shaved Englishman Chewed Dates Like Carrots.
The density of the outer layers of a star, which depends on its mass and density, plays a significant role in determining the type of spectrum. This ultimately affects the luminosity of the star. Luminosity has a strong impact on elements such as Sr II, Ba II, Fe II, and Ti II, resulting in distinct differences in the spectra of giant stars and dwarfs within the same Harvard spectral classes.
The Yerkes classification, developed by W. Morgan, F. Keenan, F. Morgan, and E. Kelman at the Yerkes Observatory, reflects the dependence of spectrum type on luminosity. It is also known as ICC, an acronym derived from the authors’ initials.
According to this classification, stars are assigned both a Harvard spectral class and a luminosity class:
Therefore, while the Harvard classification determines the Hertzsprung-Russell diagrams, the Yerkes classification determines the star’s position on this diagram. The Yerkes classification also offers the advantage of being able to estimate a star’s luminosity and distance based on its spectrum and apparent magnitude (spectral parallax method).
The Sun, classified as a yellow dwarf, falls into the Yerkes spectral class G2V.
Additional categories of stars
There are also some additional categories for certain types of stars:
cs:Spektrální klasifikace da:Spektralklasse de:Spektralklasse es:Clasificación estelar ga:Aicme speictreach gl:Clasificación estelar pl:Typ widmowy ro:Spectru stelar sv:Spektraltyp vi:Phân loại sao
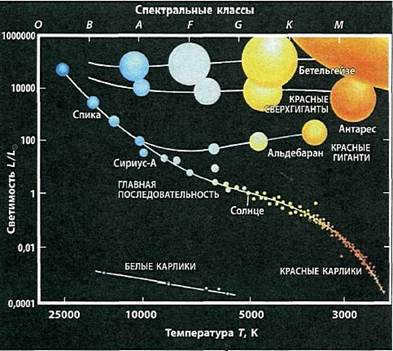
Figure 13.6: Hertzsprung-Russell diagram. The temperature of the stars is plotted on the x-axis, and the luminosity is plotted on the y-axis. The Sun’s temperature is 5780 K, and its luminosity is 1. Cooler stars, represented by the color red, are located on the right side of the diagram, while hotter stars, represented by the color blue, are located on the left side. Stars that emit more energy are positioned above the Sun, while dwarf stars are positioned below. The majority of stars, including the Sun, fall within a narrow band known as the main sequence of stars.
| White dwarfs are celestial bodies that have a radius hundreds of times smaller than the radius of the Sun and densities millions of times greater than the density of water. On the other hand, red dwarfs are stars that have a mass smaller than that of the Sun but larger than that of Jupiter. These stars maintain a constant temperature and luminosity for billions of years. Moving on, red giants are stellar objects that have a temperature ranging from 3000 to 4000 K and a radius tens of times larger than that of the Sun. Although the mass of red giants is not significantly greater than the mass of the Sun, these stars are not in a state of equilibrium. |
One intriguing aspect of the spectrum-luminosity diagram is that astronomers have yet to discover any two stars in space that possess identical physical characteristics, such as mass, temperature, luminosity, and radius. It is possible that these physical parameters change during the evolution of stars, making it highly improbable to find another star in the universe that was born at the same time as our Sun and shares identical initial parameters.
What is the total number of exoplanets that have been detected so far?
Fig. 13.6: Diagram illustrating the Hertzsprung-Russell diagram. The horizontal axis represents the temperature of the stars, while the vertical axis represents their luminosity. The temperature of the Sun, for example, is 5780 K and its luminosity is 1. Cooler stars, denoted by the color red, are located on the right side of the diagram, while hotter stars, represented by the color blue, are found on the left side. Stars that emit a greater amount of energy are positioned above the Sun, while dwarf stars are located below. The majority of stars, including the Sun, are situated within a narrow region known as the main sequence of stars.
| White dwarfs, which have radii hundreds of times smaller than the radius of the Sun and densities millions of times greater than water, are a type of star. Red dwarfs, on the other hand, are stars that have masses smaller than the Sun but larger than Jupiter. These stars remain at a constant temperature and luminosity for billions of years. Red giants, on the other hand, have a temperature range of 3000-4000 K and a radius tens of times larger than the Sun. The mass of these stars is not significantly greater than that of the Sun. However, these particular stars are not in a state of equilibrium. |
The primary enigma of the spectrum-luminosity diagram is that in the vastness of space, astronomers have yet to discover a pair of stars with identical physical attributes – mass, temperature, luminosity, and radius. It is conceivable that stars undergo changes in their physical characteristics throughout their evolution, making it highly improbable to encounter another star in the cosmos that was born simultaneously with our Sun and possesses identical initial attributes.
What is the number of exoplanets that have been detected?
Observations determine the spectral classes of stars, while known distances establish the absolute stellar magnitudes or luminosities of stars, thus revealing a correlation between the basic physical characteristics of stars.
Located in the lower left quadrant of the diagram, there is a series of white dwarfs. These diminutive stars have limited luminosity and resemble the Earth in size, with masses similar to that of the Sun.
Supergiants are massive stars that are significantly larger than the Sun. The temperature and pressure within these stars are higher compared to stars of later spectral classes. They undergo accelerated thermonuclear energy production, resulting in a higher luminosity and faster evolution.
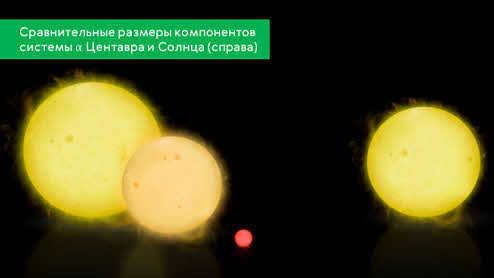
Red giants have slightly greater masses than the Sun (about 1.3 times), with radii approximately 20 times larger and luminosities 220 times greater. These stars possess a heterogeneous structure. As the hydrogen fuel depletes, a helium core forms within the star, causing the outer shell to expand.
A white dwarf is a small-sized star with a mass roughly equal to that of the Sun, but with a radius approximately 100 times smaller. The density of these stars is about 100 thousand times higher than the density of water.
4. What does stellar evolution refer to?
Stellar evolution refers to the gradual transformation of stars over time, including changes in their physical characteristics, internal structure, and chemical composition.
5. Can you provide a general overview of star formation?
Star formation occurs when matter in the interstellar medium is compressed. Stars are typically born in clusters from large gas-dust complexes, which can have sizes of up to 100 pc and contain tens or even hundreds of thousands of solar masses. The gas within these complexes is in a molecular state and has a temperature of approximately 10 K.
Fragments that are gravitationally unstable can emerge within the gas-dust cloud either randomly or due to external factors, and they subsequently undergo further contraction. The formation process can also be triggered by collisions between molecular clouds, the stellar wind emitted by young, hot stars, or shock waves generated by supernova explosions.
Luminosity classes are groups of stars that are categorized based on their spectral lines and luminosity.
148. Spectrum-luminosity diagram
At the beginning of the 20th century, the Danish astronomer Hertzsprung and the American astrophysicist Ressel discovered a relationship between the type of spectrum (temperature) and the luminosity of stars. This relationship is represented by a graph called the spectrum-luminosity diagram or the Hertzsprung-Ressel diagram (Fig. 194).
Instead of using absolute stellar magnitude, the graph can represent luminosity (usually on a logarithmic scale), and instead of spectral classes, color indices or effective temperature can be used.
Fig. 194 illustrates the section of the chart that represents stars with significant luminosity. These stars are distinguished by their large sizes at a specific temperature. On the other hand, the chart’s lower section displays stars with low luminosity. The left portion of the diagram showcases hot stars belonging to earlier spectral classes, while the right portion showcases cooler stars corresponding to later spectral classes.
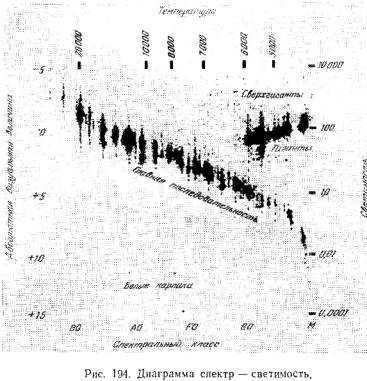
At the uppermost part of the graph, there are the stars that possess the greatest luminosity (giants and supergiants), which are distinguished by their high luminosity. Stars in the lower section of the graph have lesser luminosity and are referred to as dwarfs. The most abundant diagonal, extending from left to right, is known as the main sequence. Along this diagonal, there are stars ranging from the most intense heat (at the top) to the least intense heat (at the bottom).
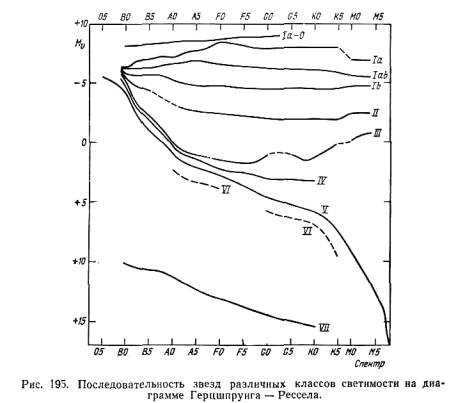
The classification of stars is determined by two parameters: the spectrum (temperature) and the luminosity. The luminosity classes, represented by Roman numerals from I to VII, are inserted after the spectral class name. For example, the Sun is classified as G 2 V, indicating that it belongs to the main sequence and falls into luminosity class V. This classification system, known as the ICC (Morgan, Keenan, Kelman), is widely accepted.
Figure 195 illustrates the luminosity classes in a schematic diagram.
Luminosity class I refers to supergiants, which occupy the upper part of the luminosity diagram and are further divided into multiple sequences.
Luminosity class II represents bright giants.
Luminosity class III corresponds to giants.
Luminosity class V consists of main-sequence stars.
There is a sequence of stars called luminosity class VI, which are bright subdwarfs. They are located below the main sequence and have a lower luminosity by about one stellar magnitude. This sequence starts from class A0 and extends to the right.
Luminosity class VII is composed of white dwarfs. These stars have extremely low luminosity and are found in the lower part of the diagram.