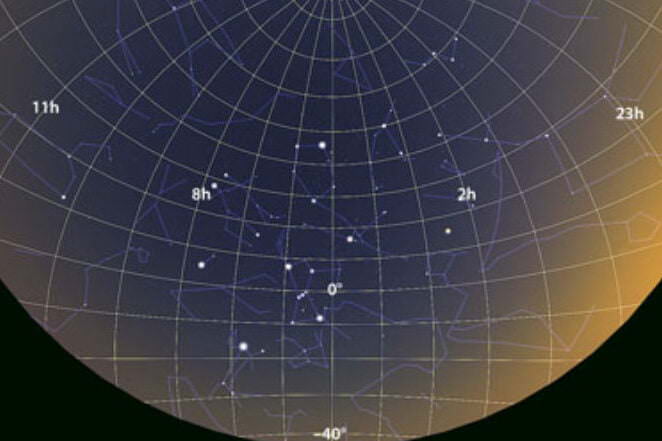
Star charts are representations of the celestial sphere projected onto a plane, with celestial objects plotted according to a specific coordinate system.
What constellations can be seen at midnight tonight?
Prepare the map and make your observations.
By rotating the circular overhead, align the date and time of observation (local time). Use Polaris to determine the cardinal directions.
When identifying stars and constellations in the northern part of the sky, face north and hold the map in front of you with the north point at the bottom. The positions of the images in the northern part of the oval on the map will correspond to their apparent positions in the northern part of the sky.
Choose the date of the observation on the map and the time on the circle that is overlaid. Then, align the overlay circle concentrically with the map so that these risks are adjacent to each other. Within the cut oval of the overlay circle, you will find a depiction of the starry sky for the specific day and hour you have selected. The shape of the cut oval corresponds to the geographical latitude of the observation site φ = 55 0
By rotating the overlay circle in a clockwise direction, you can observe how the view of the starry sky changes over time.
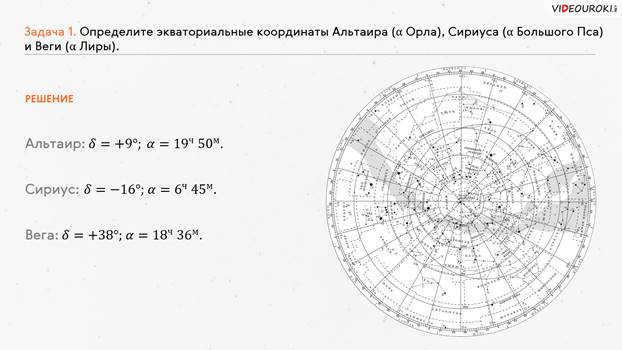
Utilizing the star map, determine the equatorial coordinates of the following stars: α Eagle (Altair), α Virgo (Spica), α Big Dog (Sirius), α Lyra (Vega).
Preparing the map and conducting observations.
The vernal equinox, represented by the symbol of the Ram – ♈, marks the starting point for measuring the direct ascension (α). The declination of celestial objects is measured along the rays emanating from the celestial equator, which is represented by a circle with a value of 0 0 0. Other circles on the map also indicate the declination of objects located on them.
To determine the direct ascension, a ruler is used. It is placed across the center of the map, the α-star of the constellation, and the edge of the map. The hours of direct ascent are marked on the edge of the map, with divisions representing 4 minutes each (a total of 15 minutes). By counting the minutes and referring to the clock readings, the direct ascension of the star can be determined.
This lesson will cover the observable daily movement of the stars. We will review the fundamental concepts, lines, and planes of the celestial sphere. Additionally, we will examine the coordinate system utilized to denote the location of stars in the heavens. Furthermore, we will become acquainted with star charts and discover how to ascertain star coordinates from a chart.
Currently, it is not possible to view or distribute the instructional video with your students
In order to gain access to this and other video lessons included in the package, you must add it to your personal account by making a purchase from the catalog.
Lesson Concept “Celestial Coordinates and Star Charts”
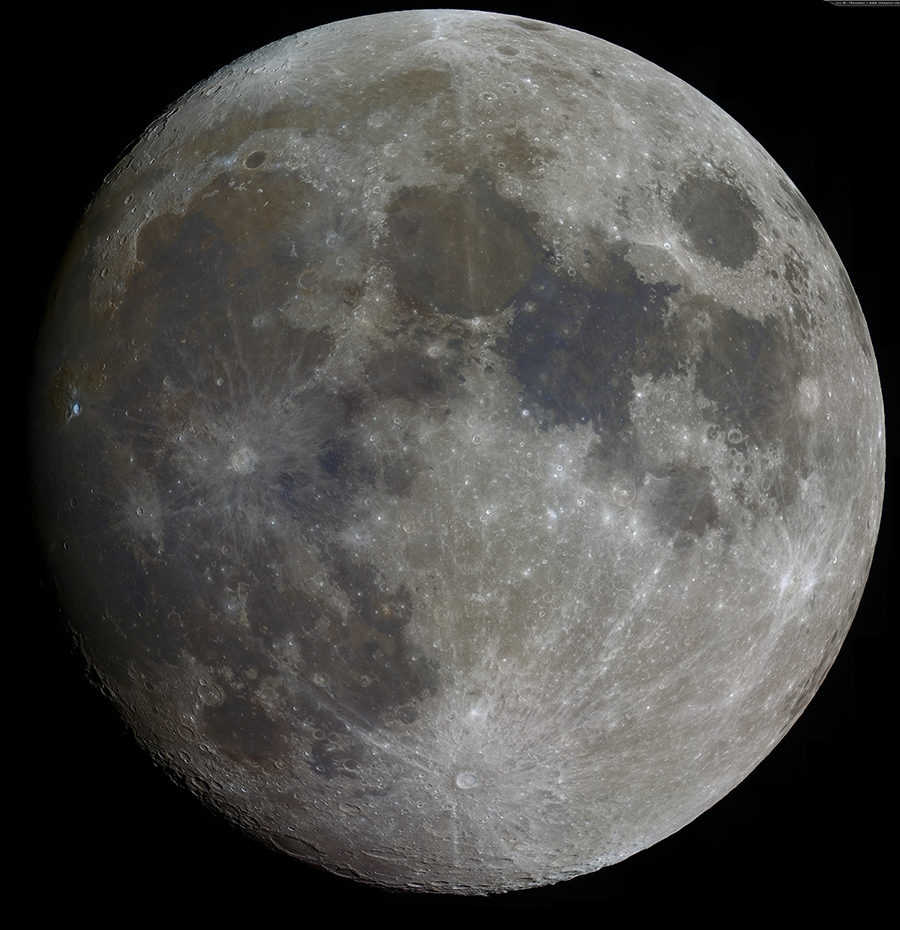
We have all witnessed the phenomenon of the Sun rising in the eastern part of the sky every morning. It emerges from behind distant objects or land formations and gradually ascends above the horizon, reaching its highest point at noon. In the northern hemisphere, the Sun is seen in the south at this time, while in the southern hemisphere, it is seen in the north. After noon, the Sun begins to descend towards the horizon and eventually sets in the western part of the sky.
The same daily movement across the sky can be observed with other celestial bodies, such as the Moon, stars, and planets. In our perception, it appears as if the entire sky is rotating around a central axis, known as the axis of the world.
When gazing at the stars on a cloudless evening in the northern portion of the sky, one can witness their motion from east to west in circular paths that revolve around Polaris (also known as the alpha star of Ursa Minor). This particular point is referred to as the north pole of the Earth. Conversely, in the southern hemisphere, there exists a point that is directly opposite to it, known as the south pole of the Earth. It is worth noting that the celestial sphere features a prominent circle, known as the circle of declination, which encompasses both the poles of the Earth and the luminary.
The celestial equator is the great circle that passes through the center of the celestial sphere and is perpendicular to the axis of the world. It divides the celestial sphere into two parts: the Northern Hemisphere, with its top located at the North Pole of the world, and the Southern Hemisphere, with its top located at the South Pole of the world.
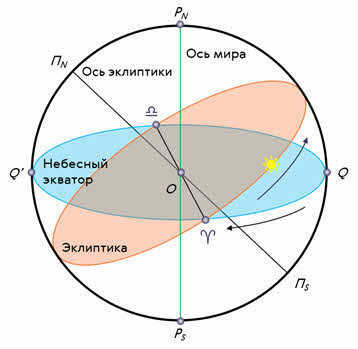
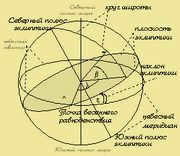
Furthermore, it is customary to mark the visible annual path of the Sun among the stars on the celestial sphere. This path is known as the ecliptic and is inclined to the celestial equator at an angle of 23 degrees 27 minutes. The ecliptic intersects the celestial equator at two points: the vernal equinox (around March 21) and the autumnal equinox (around September 23).
We now have the knowledge that the rotation of the heavens is a perceptible phenomenon resulting from the Earth’s rotation on its axis from the west to the east.
The observable movement of the celestial bodies, which occurs due to the Earth’s rotation on its axis, is referred to as diurnal motion, while the time it takes for the Earth to complete one rotation on its axis is known as a day.
In one of our initial lessons, we discussed the fact that to an observer on the Earth’s surface, it appears that all the stars are situated on a spherical surface in the sky and are equidistant from it. Let us recall that this imaginary sphere with an arbitrary radius is known as the celestial sphere.
To denote the position of the stars in the sky, a coordinate system similar to the one used in geography is employed.
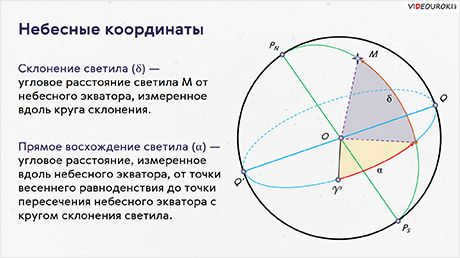
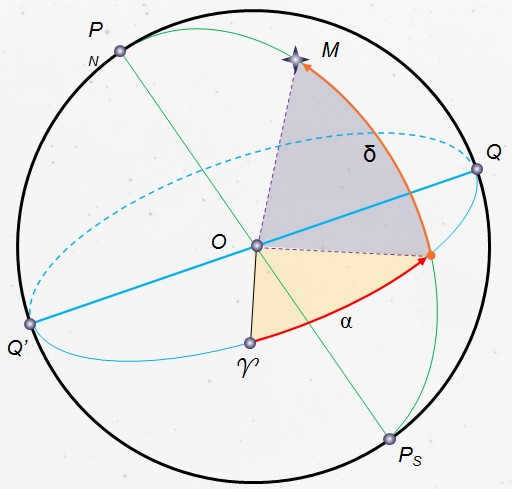
An equatorial coordinate system is used in astronomy to indicate the position of celestial objects in the sky. It is based on the celestial equator, which is the main circle of the celestial sphere. The coordinates used in this system are declination and right ascension.
Declination is similar to geographic latitude and represents the angular distance of a celestial object from the celestial equator, measured along the declination circle. It is denoted by the Greek letter δ. Positive declination values are assigned to objects located north of the equator, while negative values are assigned to objects located south of the equator. The vernal equinox is used as the reference point for declination at the celestial equator.
The direct ascension is the second coordinate that indicates the luminary’s position in the sky. It is the angular distance measured along the celestial equator from the vernal equinox to the point where the celestial equator intersects with the luminary’s declination circle.
The inclination is indicated by the lowercase Greek letter α. It is measured in the opposite direction of the daily rotation of the celestial sphere, ranging from 0 to 360 degrees or 0 to 24 hours. In astronomy, however, declination is typically expressed in hours rather than degrees. If we consider that 360 degrees is equivalent to 24 hours or 1440 minutes, then one degree is equal to 4 minutes.
The explanation is quite straightforward. Remember that in the horizontal system, the coordinates of a celestial body on the celestial sphere change over time. Therefore, they have a specific value only for a known moment in time.
In the equatorial system, the positions of stars are independent of the daily motion of the celestial sphere and change at a slow rate due to their distance from us. As a result, this coordinate system is commonly used for star globes, maps, and catalogs.
Star maps are representations of the celestial sphere projected onto a two-dimensional plane, with celestial objects plotted according to a specific coordinate system.
A collection of star maps that cover the entire sky or a specific region is referred to as a star atlas.
Star catalogs, on the other hand, provide detailed lists of stars along with their coordinates on the celestial sphere, stellar magnitude, and other relevant parameters. For instance, the Hubble Space Telescope Reference Catalog, also known as the reference star catalog-two, contains over 945.5 million stars.
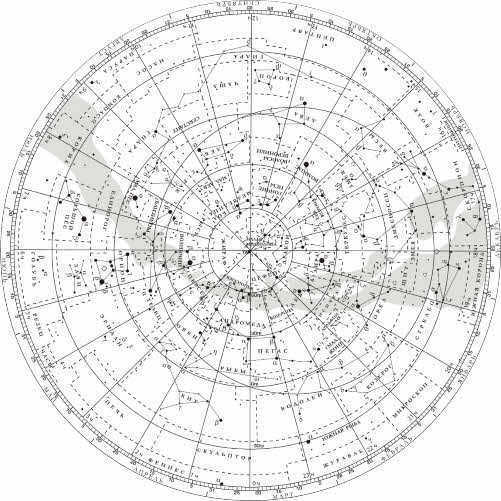
The equatorial coordinates are depicted on the map as a radial pattern emanating from the center, consisting of rays and concentric circles. Adjacent to each ray, near the map’s periphery, are numerical values indicating the right ascension (ranging from 0 to 23 hours).
The ray marking the starting point for measuring right ascension passes through the vernal equinox, symbolized on the map by the Aries symbol. Declination is measured along these rays, originating from the circle representing the celestial equator, which is denoted as zero degrees. The remaining circles also display digitized values, indicating the declination of objects positioned along their respective circles.
Stars on the map are displayed as circles of varying sizes, depending on their stellar magnitude. The stars that form recognizable constellation patterns are connected by solid lines, while the boundaries of the constellations are indicated by dotted lines.
Now, let’s explore how to utilize the star map. To do this, we will identify the equatorial coordinates of Altair (the alpha star of the Eagle constellation), Sirius (the alpha star of the Big Dog constellation), and Vega (the alpha star of the Lyra constellation).
Let’s now tackle the reverse problem, which is to locate a star based on its coordinates. Assume that the star has a declination of +35 degrees and a right ascension of 1 hour 6 minutes.
To find the answer to this question, we need to follow the same steps as before, but in reverse order. First, we locate the given right ascension on the star map. Then, we draw a mental line (or use a ruler) connecting our point to the center of the star chart. Next, we find the circle that represents a declination of 30 degrees and move approximately 5 degrees upwards from it. As a result, we will have identified the star beta Andromeda.
It is worth mentioning that the starry sky map can serve not only as a tool for locating star coordinates, but also as a means of visualizing the appearance of the night sky during a specific date and time of interest. Additionally, it can be used to determine the precise moments of star, sun, or planet rise and set.
On a frequent basis, I encounter disbelief among children regarding their ability to study and learn, as they perceive learning to be an arduous task.
Subject: Exploring the celestial heavens using a dynamic star chart
Goal: to become familiar with the dynamic star chart,
learn to assess the visibility conditions of constellations,
learn to determine the coordinates of stars on the chart
The appearance of the celestial heavens changes as a result of the Earth’s daily rotation. The changing view of the celestial heavens based on the time of year is attributed to the Earth’s orbit around the Sun. This project is aimed at acquainting oneself with the celestial heavens, solving problems related to the visibility conditions of constellations, and determining their coordinates.
The dynamic star chart is depicted in the image.
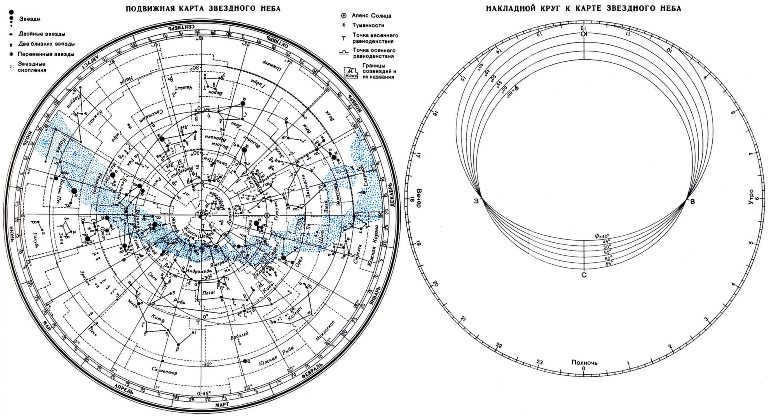
Prior to commencing your work, it is recommended that you print and utilize the movable star map. Cut out the oval overlay circle along the line that corresponds to the geographic latitude of your observation location. The cut line of the overlay circle will serve as the horizon line. Next, affix the star map and the overlay circle onto a piece of cardboard. Stretch a string from south to north along the overlay circle to indicate the direction of the celestial meridian.
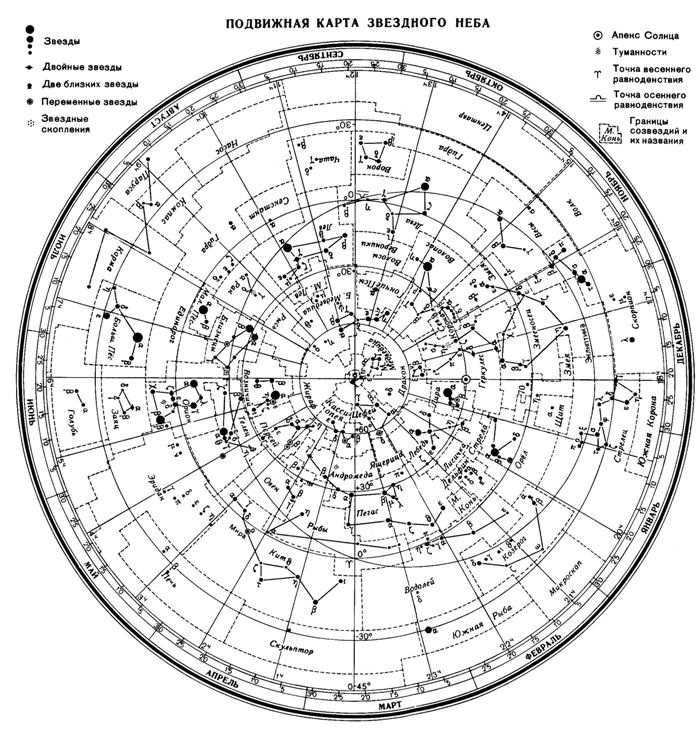
- Stars are depicted as black dots, with their sizes representing their brightness;
- Nebulae are indicated by dashed lines;
- The map centers around the North Pole of the world;
- The declination circles are indicated by the lines originating from the North Pole on the world map. The star chart displays an angular distance of 1 hour between the two closest declination circles. The celestial parallels are marked at 30-degree intervals;
- By utilizing the celestial parallels plotted at 30-degree intervals, one can determine the declination (δ) of the celestial bodies;
- The points where the ecliptic intersects with the equator, known as the vernal equinox and the autumnal equinox points, are located at 0 and 12 hours of right ascension respectively;
- The months and numbers are labeled along the edges of the star chart, while the hours are indicated on the overlaid circle.
- The zenith is situated in close proximity to the center of the cutout, specifically at the point where the filament representing the celestial meridian intersects with the celestial parallel. The declination of this celestial parallel is equivalent to the geographic latitude of the observation location.
In order to determine the position of the celestial luminary, one must combine the month and the number indicated on the star chart with the observation time on the celestial globe.
The celestial equator is a large circle on the celestial sphere, with its plane perpendicular to the axis of the Earth and coinciding with the plane of the Earth’s equator. It divides the celestial sphere into two hemispheres: the northern hemisphere, which has its apex at the North Pole, and the southern hemisphere, which has its apex at the South Pole. The constellations that the celestial equator passes through are known as equatorial constellations. They can be further classified as southern and northern constellations.
The constellations of the southern hemisphere include the Southern Cross, Centaurus, the Fly, the Sacrifice, and the Southern Triangle.
The celestial sphere has a point called the pole of the world, which is the center of the visible daily movement of stars caused by the Earth’s rotation. The direction to the North Pole of the World aligns with the direction to the geographical north, while the direction to the South Pole of the World aligns with the geographical south. The constellation of the Little Bear with Polarisissima (a bright star located on the Earth’s axis of rotation) – Polaris, is where the north pole of the world is located, while the south pole is in the constellation Octanthus.
The ecliptic represents the celestial sphere’s prominent circle that encompasses the observable annual movement of the Sun. The ecliptic plane pertains to the Earth’s orbital revolution around the Sun.
Depending on the observer’s location on Earth, the perspective of the starry sky and the nature of the stars’ daily motion transform. The stellar paths on the celestial sphere form circles with planes that run parallel to the celestial equator.
Let’s examine the alterations in the view of the starry sky at the Earth’s poles. A pole denotes a spot on the globe where the axis of the world aligns with a vertical line, and the celestial equator aligns with the horizon.
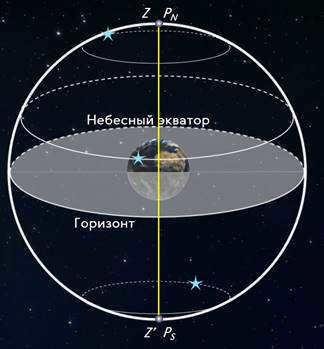
At the North Pole of the Earth, an observer will see Polaris directly above them, while the stars will appear to move in circular paths parallel to the mathematical horizon, which aligns with the celestial equator. This means that all stars with positive declination will be visible above the horizon (while at the South Pole, all stars with negative declination will be visible), and their height in the sky will not change throughout the day.
Now let’s consider the more familiar middle latitudes. Here, the axis of the Earth and the celestial equator are inclined with respect to the horizon. As a result, the daily paths of the stars will also be inclined to the horizon. Therefore, observers at mid-latitudes will be able to observe stars rising and setting.
The phenomenon of a luminary crossing the eastern part of the true horizon and setting in the western part of the horizon is known as rising stars.
In addition, there are some stars in the northern circumpolar constellations that never dip below the horizon, and these stars are referred to as non-sunsetting stars.
Similarly, the stars near the South Pole for an observer at middle latitudes will never rise above the horizon, and they are called non-sunrise stars.
Now, let’s consider the equator, where the geographical latitude is zero. Here, the world axis coincides with the noon line (i.e., it is located in the plane of the horizon), and the celestial equator passes through the zenith.
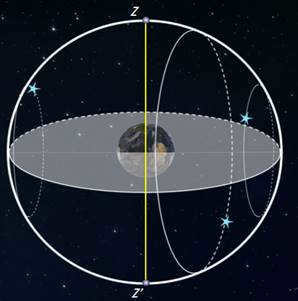
All stars, without exception, have their daily trajectories perpendicular to the horizon. As a result, an observer located on the equator will have the opportunity to observe every single star that appears and disappears throughout the day.
Typically, for a celestial body to appear above the horizon and sink below it, its absolute declination must be lower than .
If xyz condition is met, then in the Northern Hemisphere it will be non-sunrise (for the Southern Hemisphere it will be non-sunrise).
It is evident that the luminaries with a declination of are not superior in the Northern Hemisphere (or non-setting in the Southern Hemisphere).
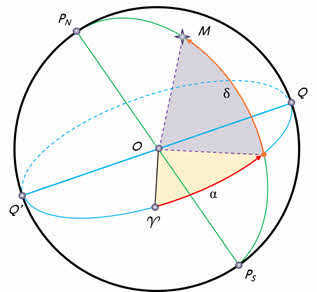
The equatorial coordinate system is a celestial coordinate system that uses the celestial equator as the main plane.
The equatorial celestial coordinates are:
1. Declination (δ) is. is the angular distance between luminary M and the celestial equator, measured along the declination circle. It is typically measured in degrees, minutes, and seconds of arc. Declination is positive to the north of the celestial equator and negative to the south. An object on the celestial equator has a declination of 0°. The declination of the north pole of the celestial sphere is +90°, and the declination of the south pole is -90°.
2. The direct ascension of a luminary (α) represents the angular distance measured along the celestial equator, from the point of the vernal equinox to the point where the celestial equator intersects the circle of declination of the luminary.
Sequence of practical tasks:
Goals of the practical assignment:
Task 1. Determine the equatorial coordinates of Altair (α Eagle), Sirius (α Big Dog), and Vega (α Lyra).
Task 2. Find the star on the star map using its coordinates: δ = +35o; α = 1h 6m.
Task 3. Determine which star δ of Sagittarius is for an observer located at latitude 55o 15ʹ. Determine whether the star is ascending or non-ascending in two ways: using the overlapping circle on the rotating star map and using the formulas for determining the visibility of stars.
Practical approach. Place the rotating circle on the star map and observe whether the star is ascending or non-ascending.
If the star is rising and setting, then it is in motion.
If the star in the Northern Hemisphere is not ascending, then…
If the star in the Northern Hemisphere is not rising, then …
Problem 4: Create a dynamic map of the night sky for the specified date and time, and identify the constellations located in the southern part of the sky from the horizon to the celestial pole; in the east – from the horizon to the celestial pole.
Task 5: Identify the constellations that lie between the west and north points on October 10 at 21:00. Verify the accuracy of the identification by visually observing the night sky.
Task 6: Find constellations that have nebulae marked on the star map and determine if they can be seen with the naked eye on the specified date and time of the lab work.
Task 7: Determine if the constellations Virgo, Cancer, and Libra will be visible at midnight on September 15. Which constellation will be near the northern horizon at the same time?
Task 9. Locate and identify the approximate celestial coordinates (declination and right ascension) of the following constellations on the star map: Ursa Major, Ursa Minor, Cassiopeia, Andromeda, Pegasus, Cygnus, Lyra, Hercules, and Corona Borealis.
Problem 10. Determine the constellations that will be visible near the horizon in the North, South, West, and East at midnight on May 5th.
Control questions to reinforce the theoretical concepts covered in the practical lesson:
1. What is the starry sky? (The starry sky is a vast expanse of celestial lights that can be seen from the Earth at night, spread across the firmament. On a clear night, an individual with keen eyesight can observe up to 2-3 thousand shimmering dots in the firmament. Thousands of years ago, ancient astronomers divided the starry sky into twelve sectors, assigning them names and symbols that are still recognized today.)
2. What are constellations? (Constellations are designated regions in the celestial sphere that facilitate navigation in the starry sky. In ancient times, constellations were referred to as distinct shapes formed by prominent stars.)
3. How many constellations are there at present? (There are currently 88 constellations. Constellations differ in terms of the area they encompass in the celestial sphere and the number of stars contained within them.)
4. Enumerate the major constellations or the ones you are familiar with. (There are both major and minor constellations. The major ones include the Big Dipper, Hercules, Pegasus, Aquarius, Wolopassus, and Andromeda. The minor ones include the Southern Cross, the Chameleon, the Flying Fish, the Small Dog, and the Bird of Paradise. Of course, we have only mentioned a small fraction of the most well-known constellations.)
5. What is a sky map? It is a representation of the starry sky or a portion of it on a two-dimensional plane. Astronomers have divided the sky map into two parts: southern and northern (similar to the hemispheres of the Earth)..)
6. What is the celestial equator? (It is a large circle on the celestial sphere, with its plane perpendicular to the axis of the Earth and coinciding with the plane of the Earth’s equator.)
Upon completion of the practical assignment, students are required to submit a comprehensive report.
The report must address all the specified tasks and provide answers to any control questions.
If you are the original author or copyright holder of the material and have concerns about its usage on my website, please reach out to me. I will promptly remove the information upon request.
A special thank you to the authors and copyright holders who have granted permission for their materials to be featured on my site! Your contribution is invaluable to the education, upbringing, and development of the younger generation.
When using the PCZN, you have the ability to determine the appearance of the night sky, as well as the moments when stars rise and set, along with their equatorial coordinates.
It is common knowledge that star charts are representations of the celestial sphere projected onto a plane, with objects plotted on it using a specific coordinate system.
Let’s take a closer look at the SEM. It consists of two parts – a movable part and a stationary part. On the movable part, we can see a collection of constellations.
In modern times, constellations are defined as specific areas of the night sky that are divided by well-established boundaries, and they typically have a distinctive arrangement of observable stars.
On the PCZN, we can observe numerous constellations from the northern hemisphere, which are separated from each other by dotted lines. One example is the Orion constellation.
After examining this particular group of stars closely, one can observe that nearly all of them are identified by Greek letters and their size varies when plotted. This discrepancy can be attributed to the fact that, when gazing at the night sky, it becomes evident that each star possesses its own unique level of luminosity.
In 1603, a German astronomer named Johann Bayer introduced his system for labeling stars, which is still in use today. Under this system, a star’s name consists of two components: the name of the constellation it belongs to and a letter from the Greek alphabet. The letter designation is typically assigned based on the star’s brightness within the constellation, with the brightest stars receiving the earliest letters.
Nevertheless, it is common knowledge that there are always exceptions to any rule: take, for example, the constellation of Ursa Major, known for its seven brilliant stars that form the renowned Big Dipper. Interestingly, these stars were originally labeled from right to left. Another exception can be found in the constellation of Orion, where the star β shines brighter than α.
What other valuable insights can be gleaned from working with the PCZN?
All celestial objects are plotted using the equatorial coordinate system. This system is preferred because the coordinates of the stars remain unaffected by the daily motion of the celestial sphere and change at a very slow pace due to their significant distance from us.
The coordinates in this system are referred to as declination and right ascension.
Now, let us explore how the SCZN can be utilized to determine the equatorial coordinates of α Virgo.
To accomplish this task, we can locate the constellation Virgo and identify its star α. In order to determine the right ascension, we can draw a line that passes through the celestial pole and intersects with our star. The point of intersection with the map’s edge will provide us with the value of this coordinate, which is 13.25.
In order to determine the celestial body’s declination, we can refer to the concentric circles displayed on the map, which range from +90 degrees to -45 degrees. The star can be found between the 0 and -30 circles. Considering any potential error, we can assume that the declination of this star is -11 degrees.
Now, let’s solve the inverse problem – locating a star based on its coordinates. Let’s say the star has a declination of +27 degrees and a right ascension of 23 hours and 00 minutes. This corresponds to the star β Pegasus.
It’s important to mention that the star map can serve not only as a tool for locating star coordinates, but also for determining the exact view of the night sky at a specific time. In order to do this, one must align the date on the stationary part of the map and the time on the movable part. For instance, let’s take February 25th at 5 o’clock. Only celestial objects displayed on the white background are observable, while the rest are not.
Furthermore, with the assistance of PCZN, one can ascertain the precise times when stars, including the Sun, appear on the horizon. When we refer to “rising,” we mean the event where a celestial body crosses the eastern section of the true horizon, and when we mention “setting,” we are referring to the western section of the horizon.
In order to determine the exact moment of the star Volopasa’s rising on September 30, the following steps should be followed:
First, align the eastern section on the movable part of the map with the star on the fixed part.
Next, on the movable part of the star map, pinpoint the specific moment of the star’s rising. The sunrise will occur at 6.00.
To establish the exact moment when this star appears, the following steps should be taken:
1. Place the western part of the map on the movable part and align it with the fixed part, ensuring that the star is also aligned.
2. Look at the time indicated on the movable part of the map, which should be 21.50.
3. Repeat the process on the movable part of the map to verify the time of the star’s appearance.
The same actions can also be done for the Sun, but it is important to keep in mind that the Sun, like other stars, follows its own path in the sky.
In order to determine the position of the Sun, one must draw a line from the North Pole, passing through a specific date, and where it intersects with the ecliptic will give us the Sun’s position.
By utilizing SCPN, you have the ability to establish a unique perspective of the celestial sky, capturing the precise moments when stars rise and set, along with their respective equatorial coordinates.
During the 19th century, astrologers emphasized the significance of declination aspects. Zadkiel, for instance, believed that the impact of a parallel aspect was equivalent to that of an exact conjunction, but with greater intensity. Likewise, Bishop-Culpepper noted that while conjunction and opposition held a comparable strength to parallel aspects, they did not quite match it.
In the 20th century, there were also astrologers who utilized and appreciated elements of declination. According to Charles Jayne, neglecting declination in certain astrological charts would result in missing the essential point. Additionally, John Willner, a modern astrologer, emphasizes that declination aspects offer a plethora of valuable information, and without considering them, astrologers would be disregarding over half of the information available in natal and progressed charts.
Part of the reason why astrologers may not be aware of declination is because many astrology programs lack proper features for dealing with declination aspects.
However, let’s explore the concept of declination and how these aspects are defined.
A straightforward explanation
To exhaustively define declination, one only needs a few words: It is the angular distance from a planet to the celestial equator. That’s the essence of it. However, for astrologers who are not well-versed in the intricacies of astronomy – and there are many – this definition holds no more significance than a proverb from Lao Tzu in Mandarin. Throughout my three decades of teaching astrology to various audiences, I have realized that in many cases, people do not require precise definitions with all the technicalities. A general understanding and the ability to apply a specific concept is more than enough. So, what is the purpose of declination?
It is common knowledge that the geographical location of a city or town on Earth is determined by its longitude and latitude. Longitude is measured along the equator, starting from the prime meridian in Greenwich. For instance, Moscow is located at a longitude of approximately 37.5° east. However, longitude alone does not provide a complete picture in geography. Donetsk also has a longitude of about 37.5°, and the African city of Port Sudan does not differ much in longitude either. Without the second dimension, latitude, one might mistakenly assume that these vastly different places are in close vicinity to each other.
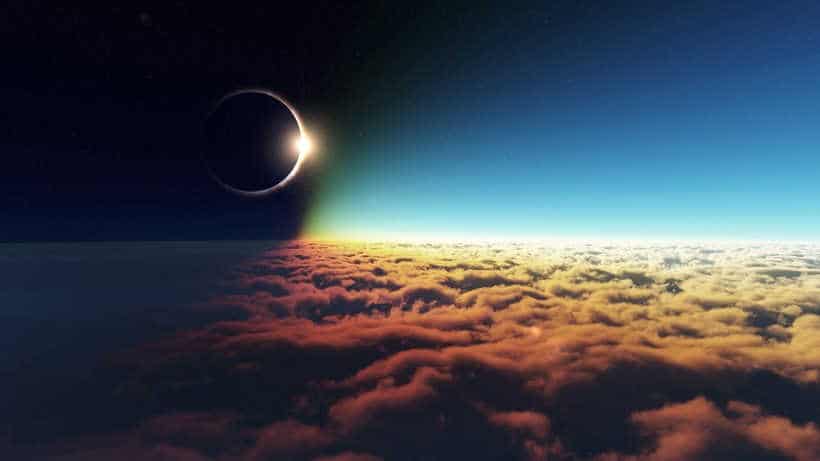
Another instance that showcases the significance of the second dimension in astrology is the contrast between a typical new moon and a solar eclipse. Both are seen on a regular astrological chart as a conjunction of the Sun and Moon. However, during an eclipse, the Moon blocks the Sun, whereas this does not occur during a regular new moon. Why does this happen? It’s because during a regular new moon, even though the Sun and Moon are at the same point in longitude, their positions in the second dimension differ.
In practical terms, in the overwhelming majority of cases, it is sufficient to define declination as the second coordinate of the planet, enabling us to determine its position in the sky. Declination is akin to geographic latitude, which, in conjunction with geographic longitude, unequivocally establishes the location of a settlement on the Earth’s surface.
Now, let’s discuss the practical methods for determining a planet’s declination and delve into the various aspects of declination.
Methods for Determining a Planet’s Declination
There are several approaches to determining a planet’s position in the second dimension, known as declination. Similar to geographic latitude, declination is measured in degrees and minutes, and can be either north or south. Typically, a celestial object’s declination falls between 0º and 90º, but the declination of planets is usually limited to a range of 0º to 30º.
Current data
If you’re interested in finding out the present locations of the planets, including their declinations, you can easily do so by visiting the astrology section of my website. On the “Planets” table, you’ll find the current zodiacal positions of the planets, while the “Declinations” table displays their declinations. Some of the planets may have the abbreviation “OOB” next to them, which stands for “off-limits”. I will discuss this further in a future article. Take a look at the screenshot below to see how this information appeared on a similar page of my English site on June 10, 2021:
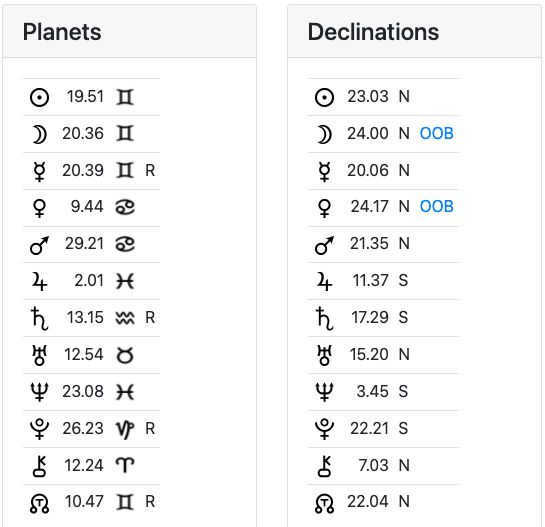
It is evident that the Sun and Moon are in a relatively close conjunction. One can infer that there has been a recent occurrence of either a new moon or a solar eclipse. However, by referring to the declination table, it becomes apparent that these celestial bodies are also in close proximity in terms of declination. Therefore, they are currently visible in the sky together, with the Moon having recently obstructed the Sun’s light from reaching the Earth, resulting in a solar eclipse.
There are various aspects that planets can form in terms of longitude, such as conjunction, opposition, trine, quadrature, and more. There are also minor aspects and creative aspects, and some astrologers even use more exotic groups of aspects. However, when it comes to declination, things are much simpler, as there are only two aspects: parallel and counter-parallel.
If the declinations of two planets are close to each other in value and both are either northern or southern, a parallel declination is formed between these planets. On the other hand, if one planet has a north declination and the other has a south declination, a counter-parallel aspect is formed between them. Typically, an orb of 1° is used, although some schools prefer 1° 12′.
According to some astrologers, a parallel is similar to a conjunction, while a counter-parallel is comparable to an opposition. Among the modern authorities, Jeff Mayo, Barbara Watters, and Charles Jane share this perspective. However, there are also numerous notable astrologers who argue that parallel and counter-parallel are essentially the same aspect, with no significant distinction between them. This group includes Charles Carter, Ronald Davison, Sepharial, and the Magi Society school. Personally, I believe that parallel and counter-parallel are distinct, although the difference is not substantial, and there is certainly no sense of opposition in a counter-parallel.
Declination in ephemerides
Are you curious about the declination of the planets on the day you were born? Or do you want to track how the declination changes over time? Ephemerides come in handy for this purpose. However, it’s important to note that not all ephemerides available in book form provide information about declination. For instance, The American Ephemeris, which is quite popular, does not include this data. On the other hand, Raphael’s Ephemeris does.
Another option is to use the PDF ephemeris that is freely available on Astro.com. Simply go to the site’s menu and locate the “9000 Years Ephemeris” page. From there, select the section of the century that interests you and find the specific year you are looking for under the “with declination and latitude” heading. To help you navigate, here is a screenshot pointing out where to find the ephemeris with declination for the year 2021:
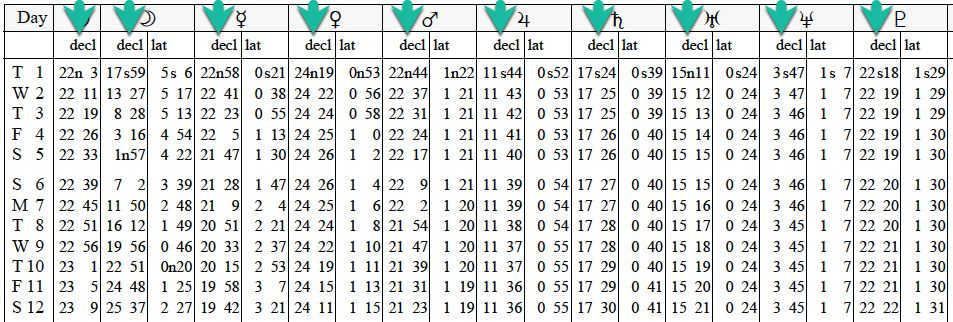
After downloading the ephemerides, you will discover that each month is allocated a dedicated page. The top section of the page contains a table displaying the ecliptic longitude of the planets, similar to any other ephemeris. The bottom table, on the other hand, provides information on the declination and ecliptic latitude. In the accompanying screenshot, the columns representing the declination are clearly indicated by arrows.
Declinations in astrology software
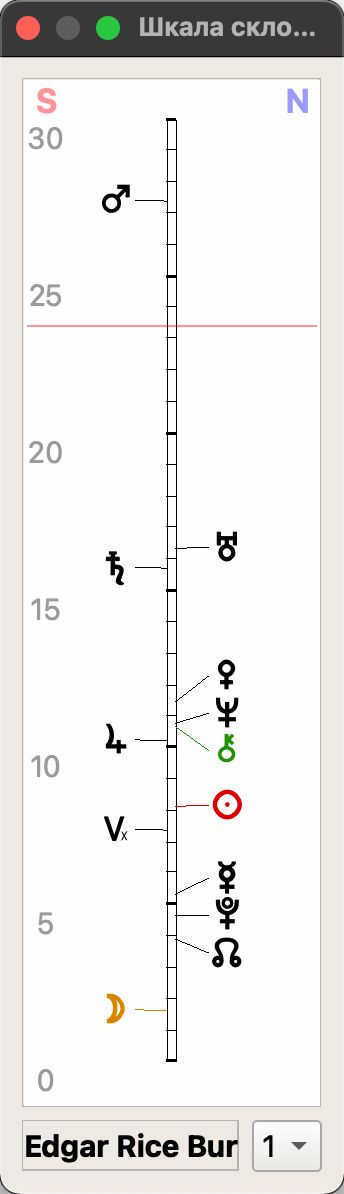
A lot of astrology software includes the calculation of planetary declinations in their charts. However, I would like to specifically recommend the Zeus Astroprocessor, created by Dmitry Potapov, because he has developed some special tools on my suggestion that simplify working with declinations. One of these tools is the declination scale, which allows you to quickly identify declination aspects and forbidden planets:
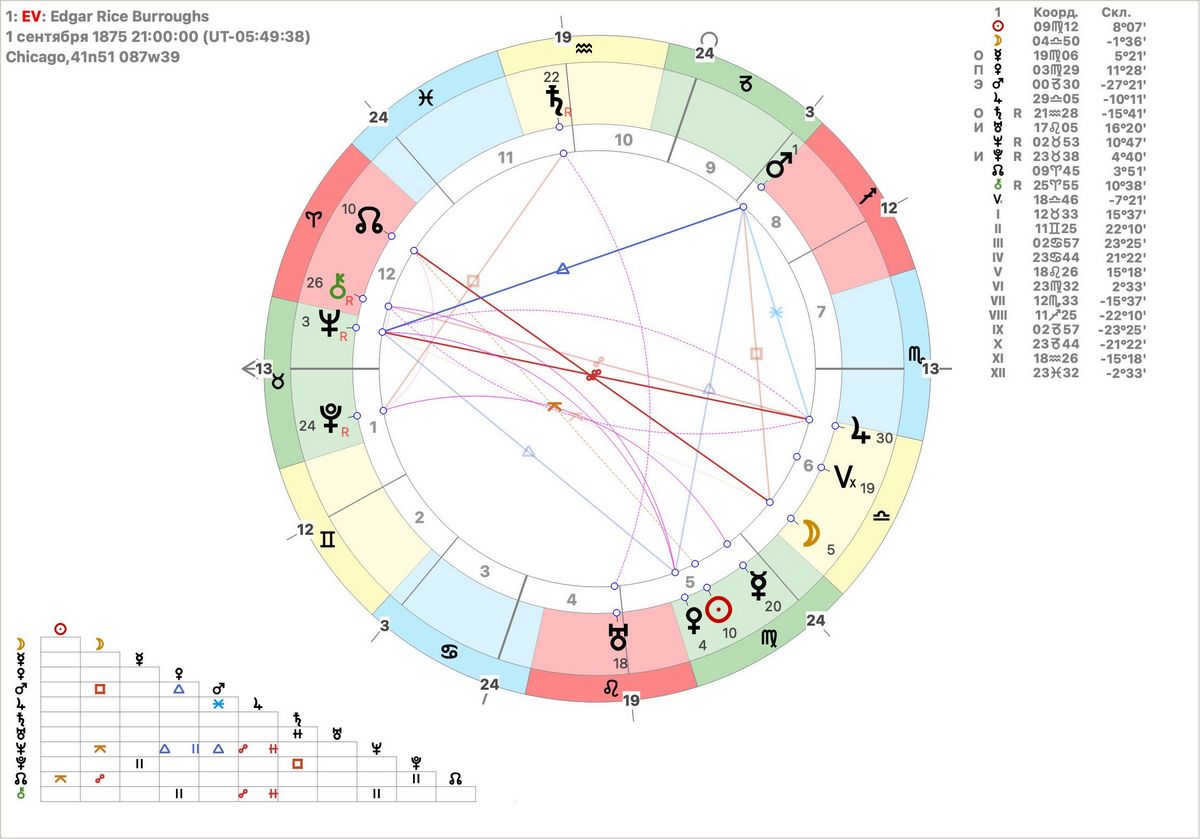
Zeus’s natal chart displays declination aspects in arched form. The aspect table located at the bottom left reveals both longitude and declination aspects. Furthermore, the table positioned at the top right showcases the planetary positions of all planets and house cuspids, displaying not only ecliptic longitude but also declination.
One more exclusive feature provided by Zeus – the synastric aspect table – will be demonstrated at a later time.
Precise definition of declination (not applicable to all cases)
While in most situations it is sufficient to understand that declination is the second dimension, along with ecliptic longitude, to accurately determine the position of a planet in the sky, there may be instances where a more detailed understanding of declination, in astronomical terms, is necessary. For those meticulous readers, I offer an explanation.
First and foremost, it is important to acknowledge that there are multiple coordinate systems available to us for determining the position of a planet (or any other celestial body) on the celestial sphere. The choice of which coordinate system to use depends on the practical task at hand. However, all of these systems share a common feature: they utilize two coordinates, much like the longitude and latitude system used in geography.
When it comes to astrology, we typically rely on one specific coordinate system known as the ecliptic system. Within this system, a coordinate analogous to geographic longitude is referred to as ecliptic longitude. This measurement is taken along the ecliptic, which represents the apparent path of the Sun in relation to the stars. As you may already be aware, the zodiacal positions of the planets commonly used in astrology correspond to their ecliptic longitudes.
You may have noticed that I haven’t mentioned the primary character of this article yet, declination. Where is it?
There is an alternative coordinate system known as equatorial. In fact, it is most similar to a geographic coordinate system because it has one of the coordinates measured along the equator – but in this case, it is the celestial equator. The name of this coordinate is a bit unique, direct ascent. However, you can disregard it right away, as we won’t require it anywhere. What we will truly require is the second coordinate of the equatorial system, similar to ecliptic latitude. It is called, as you might have guessed, declination..
Therefore, the suggested method by astrologers who analyze tangible occurrences is rather unconventional. They employ one coordinate (ecliptic longitude) from the ecliptic system and another coordinate from the equatorial system (declination or celestial equator distance). Although unorthodox, this technique has proven to be effective (and there exist more intricate and profound explanations for its efficacy, which I will not explore in this particular piece).
What is the importance of understanding declension?
In this article, I have provided an in-depth explanation of declension and its definition. You may be wondering if it is really necessary to understand this concept. However, knowing about declension and its various aspects can be highly beneficial.
Put simply, in numerous instances the declination parallels and counter-parallels present in an astrological chart offer us with information that would otherwise be unattainable. This data may be crucial in the instance we are examining. When examining a natal chart, declination aspects can assist us in perceiving and comprehending talents and abilities (as well as problems) that are not evident in longitude. When working on a forecast, we may overlook a highly significant event or life change if we do not take into account parallels and counter-parallels. However, in my viewpoint, the most effective and persuasive way to illustrate the significance and potency of the declination aspects is through the investigation of non-trivial relationships.
Charles had a gorgeous wife in her youth, along with two kids, however, he ultimately abandoned them to rekindle an earlier love affair. Maybe Charles and Camilla have a unique connection, a powerful energy that we, as astrologers, eagerly anticipate to witness through the astrological symbolism inherent in their relationship.
When it comes to synastry, there are various approaches that can be utilized. However, the primary method typically involves analyzing the mutual aspects formed between the natal charts of the individuals involved. In this case, we have a chart displaying the mutual aspects between Charles and Camilla, which was created using the popular western astrology software Astro Gold. To ensure accuracy, I focus on the most precise aspects and use a narrow orbit of 3 degrees for longitude aspects. Additionally, I do not take into account house cuspids, even if they are angular, as their positions may not be reliable without careful rectification. While we can only observe aspects between the partners’ planets, it is important to remember that planets play a crucial role in astrology and are often capable of revealing the essence of the story.
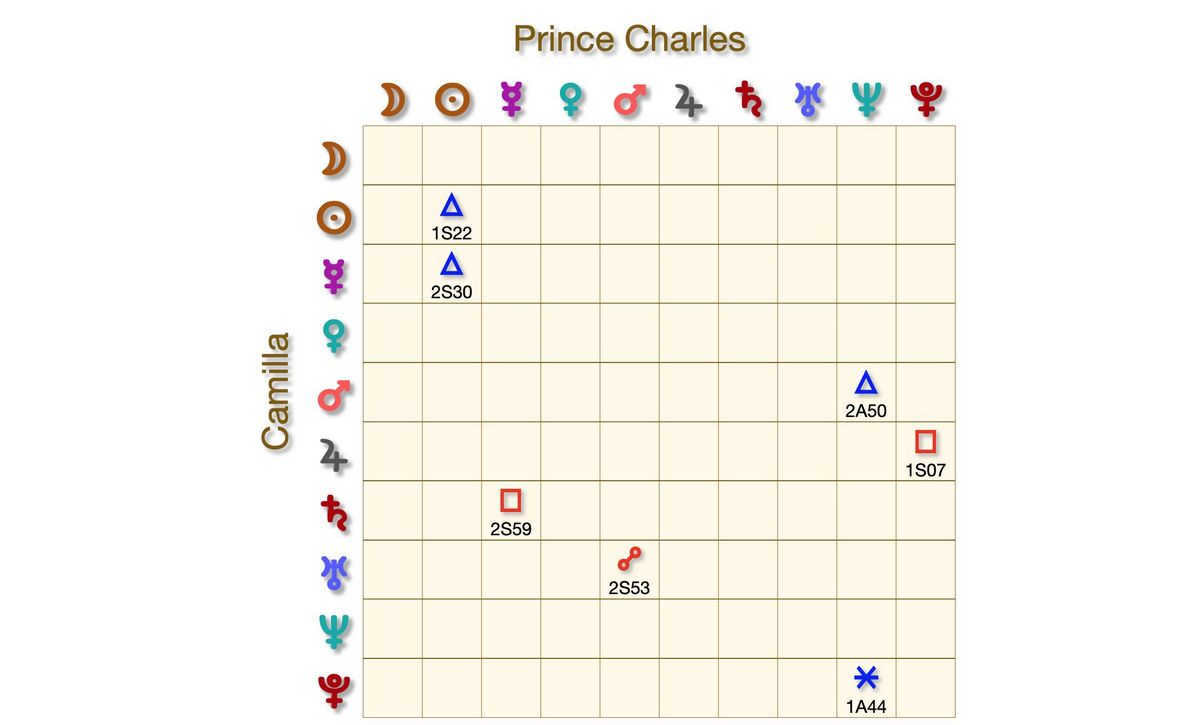
Now, let’s examine the factors that are created between these partners in declination. In this case, we have an invaluable tool called Astroprocessor Zeus, which is currently the only astrological program that can display synastric aspects in both longitude and declination.
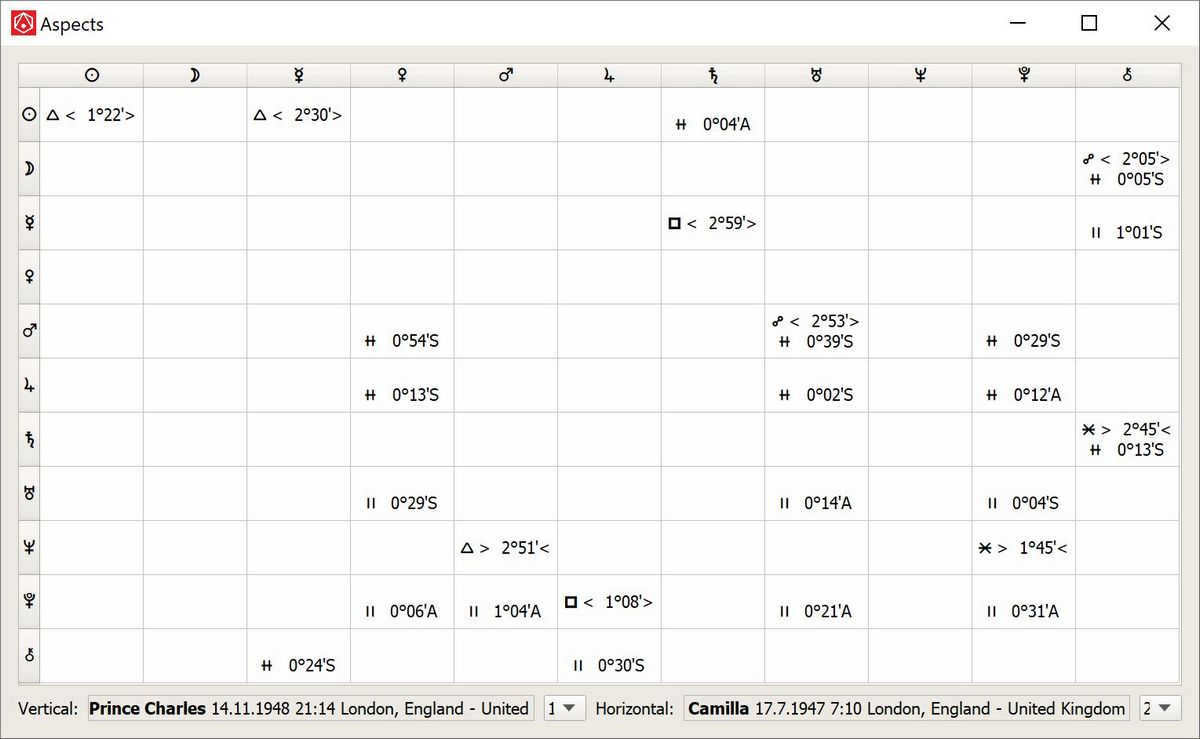
In the analysis of Prince Charles and Camilla’s astrological charts, it is evident that there are several significant connections between them. Specifically, Camilla’s Venus forms precise aspects with Charles’ Mars, Jupiter, Uranus, and Pluto. Additionally, there are mutual Mars-Pluto aspects: Charles’ Mars is counter-parallel to his Pluto, while Camilla’s Mars is parallel to Charles’ Pluto. These aspects represent a deep ocean of passion between the two individuals. It is worth noting that when comparing the aspects between Charles and his previous wife Diana, no similar connections are found.
Take a moment to analyze the other intricate connections I mentioned independently. Explore the shared characteristics of longitude and ponder whether they can elucidate the distinctiveness of the situation. Then consider the implications of declination and contemplate whether they unveil the truth of what truly transpired. For instance, in the scenario of Harry and Meghan, you will discover shared parallels between their Suns and Moons, traditional elements of matrimony. They were destined for each other. And if you are curious about how I approach these captivating cases, as well as divulge more about declination, aspects of declination, and their practical application, you have the opportunity to view the recording of my webinar, “Forgotten Astrology: declination, aspects of declination, and the forbidden planets”.
Conclusion
I highly recommend incorporating declination and aspects of declination into your astrological practice. This is especially important when you find that the traditional approach to astrology, which ignores declination, is not providing you with enough insight.
© 2023 Alexander Kolesnikov
Celestial coordinate systems are utilized in astronomy to delineate the positions of celestial bodies in the sky or points on an imaginary celestial sphere. Celestial coordinates are marked on the geometrically regular surface of the celestial sphere through a coordinate grid, similar to the grid of meridians and parallels on Earth. The coordinate grid is established by two planes: the plane of the system’s equator and its associated poles, as well as the plane of the initial meridian.
When it comes to astronomy, numerous celestial coordinate systems are employed to tackle diverse scientific and practical issues. These systems rely on the utilization of established planes, circles, and points found on the celestial sphere.
The Horizontal Coordinate System [ ]
In the horizontal celestial coordinate system, the primary circle is the true horizon, and the coordinate, similar to geographic latitude, is the altitude (above the horizon) h. It is measured from the plane of the horizon with a positive value in the visible hemisphere of the celestial sphere and with a negative value in the invisible hemisphere below the horizon. Therefore, altitudes, like latitudes on Earth, can range from +90 to -90 degrees. The celestial sphere has a circle where all points have the same altitude, similar to a geographic parallel, known as an almucantaratus. Instead of altitude in
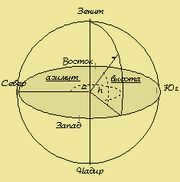
Astronomy often utilizes the zenith distance z = 90°-h. In terms of geometry, the zenith distance z represents the angle between the zenith and the direction of an object; it is consistently positive and ranges from 0 (for the zenith point) to 180° (for the nadir point).
The horizontal coordinate system’s equivalent of geographic longitude is the azimuth, which is the dihedral angle formed by the vertical plane passing through the zenith and the point being observed, and the plane of the celestial meridian.
Given that both of these planes are at right angles to the plane of the mathematical horizon, the measurement of the dihedral angle can be the corresponding angle between their projections on the horizontal plane (alpha). In the field of geodesy, it is customary to measure azimuths in a clockwise direction from a northern point (passing through eastern, southern, and western points) ranging from 0 to 360 degrees. In astronomy, azimuths are also measured in the same direction, but often starting from a southern point. Therefore, astronomical and geodetic azimuths differ by 180 degrees. Hence, it is important to determine the type of azimuth when solving a specific problem on the celestial sphere.
A unique example of the concept of “azimuth” can be found in navigation and meteorology, where it is referred to as rhumbas. In the field of maritime navigation, the circumference of the horizon is divided into 32 rhumbas, while in meteorology it is divided into 16. The primary rhumbas are the directions to the north, east, south, and west. The remaining directions are named in relation to the main ones, such as northwest or southeast, which lie respectively between north and west, and south and east. Additionally, there are more specific fractional rhumbas, such as north-northwest, which lies between north and northwest, and east-southeast, which lies between east and southeast. Therefore, a rhumb represents a rounded value of azimuth.
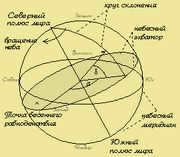
Equatorial system of celestial coordinates [ ]
In the equatorial celestial coordinate system, the celestial equator serves as the reference plane. The coordinate, which is similar to the geographic latitude on Earth, is known as the declination of the celestial object. It represents the angle between the direction to the object and the plane of the celestial equator. The declination is measured along the hour circle from the celestial equator, with a positive sign in the northern hemisphere of the celestial sphere and a negative sign in the southern hemisphere. Its values can range from +90 to -90 degrees. The diurnal parallel is the geometric locus of points with equal declinations.
The second coordinate in the equatorial system is inputted in two different manners.
In the initial scenario, the plane of the celestial meridian of the observation location functions as the starting plane; the coordinate, akin to terrestrial longitude, is referred to as the hour angle and is measured in hours, minutes, and seconds. The hour angle is calculated from the southern portion of the celestial meridian in the direction of the daily rotation of the sky towards the luminary’s hour circle. As a result of the sky’s rotation, the hour angle of the same luminary fluctuates between 0 and 24 hours throughout the day. This celestial coordinate system is known as the first equatorial system. The hour angle is influenced by both the observation time and the observation location on the Earth’s surface.
In the second scenario, the initial plane corresponds to the plane that passes through the axis of the world and the vernal equinox point. This plane rotates alongside the entire celestial sphere. The coordinate, which is similar to the longitude of the Earth, is referred to as direct ascension ‘(alpha) and is measured in hours, counter to the rotation of the starry sky. Its values range from 0 to 24 hours for various celestial bodies. However, unlike the hour angles, the direct ascension of a given celestial body remains constant throughout the daily rotation of the sky and is not influenced by the observation location on the Earth’s surface. Both declination and direct ascension play key roles in celestial observations.
Ecliptic system of celestial coordinates [ ]
In the ecliptic coordinate system, the primary plane is known as the ecliptic plane. To ascertain the location of a celestial object, a large circle is drawn through the object and the pole of the ecliptic, referred to as the circle of latitude for that specific object. The distance between the ecliptic and the object along this circle is referred to as the ecliptic latitude (or
The celestial coordinate system consists of two coordinates: latitude and ecliptic longitude. Latitude, also known as beta, ranges from 0 to 90° and indicates the distance from the celestial equator to the north or south pole of the ecliptic. A positive value indicates the north pole, while a negative value indicates the south pole. On the other hand, ecliptic longitude, also known as lambda, is measured from the plane that passes through the poles of the ecliptic and the vernal equinox point. This coordinate represents the direction of the Sun’s annual motion and can take values from 0 to 360°. It is important to note that the coordinates of stars in the ecliptic system remain constant throughout the day and are independent of the observer’s location.
Galactic celestial coordinate system [ ]
The galactic coordinate system of celestial bodies is utilized for the examination of our Galaxy, and has recently gained popularity. The primary plane in this system is the plane of the galactic equator, known as the plane of symmetry of the Milky Way. Galactic latitudes b are counted both north and south of the Galactic equator, with the use of the “plus” and “minus” signs, respectively. Galactic longitudes l are counted in the direction of increasing right ascension from the plane that passes through the poles of the Galaxy and the point where the Galactic equator intersects the celestial equator. Ecliptic and galactic coordinates are derived through calculations based on equatorial coordinates, which are directly determined from astronomical observations.
Modifications in coordinates during the rotation of the celestial sphere [ ]
The elevation h, zenith distance z, azimuth A, and hour angle t of the celestial objects are continually altering as a result of the rotation of the celestial sphere, as they are measured from points unrelated to this rotation.
The declination δ, polar distance p, and right ascension α of the celestial objects remain unaffected by the rotation of the celestial sphere, although they may vary due to the motions of the celestial objects unrelated to the daily rotation.
Utilization of various coordinate systems [ ]
The horizontal coordinate system is employed to ascertain the direction to a celestial body by means of angle measuring instruments, as well as when observing through a telescope affixed to an azimuthal mount.
The initial equatorial coordinate system is utilized to determine the precise time and for observations through a telescope affixed to an equatorial mount.
The secondary equatorial coordinate system is a prevalent coordinate system in astrometry. This system is employed to create star maps and describe the positions of celestial bodies in catalogs.
The ecliptic coordinate system is utilized in theoretical astronomy to ascertain the orbits of celestial bodies.
Sources [ ]
Podobed V.V. Fundamental astrometry. Establishment of the fundamental system of celestial coordinates. – Moscow: Nauka, 1968.
Klishchenko A.P., Shupliak V.I. Astronomy. – M.: New Knowledge, 2004.
Big Soviet Encyclopedia

Movement of stars at various latitudes around the globe

Observing the apparent movement of stars from various latitudes on Earth
OP – the Earth’s axis, aligned parallel to the equator
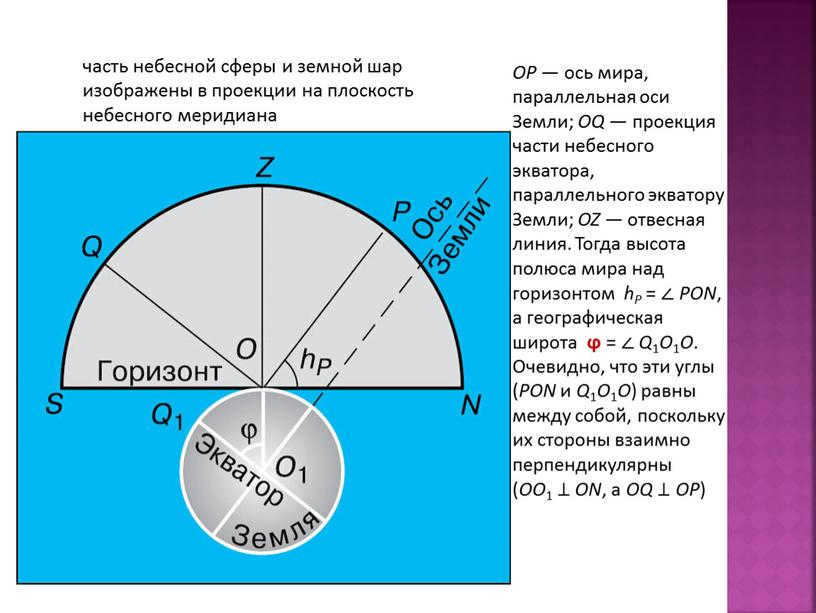
The projection on the celestial meridian plane depicts a section of the celestial sphere and the globe.
OP represents the world axis, which is parallel to the Earth’s axis. OQ represents the projection of a portion of the celestial equator parallel to the Earth’s equator. OZ represents the plumb line. The height of the world pole above the horizon is denoted as hP and can be calculated as the angle PON. The geographical latitude is represented by ϕ and can be calculated as the angle ∠Q1O1O. It is evident that these angles (PON and ∠Q1O1O) are equal since their sides are mutually perpendicular (OO1 ⊥ ON and OQ ⊥ OP).
Therefore, it can be deduced that the elevation of the global pole from the horizon corresponds to the geographical latitude of the observing location: hP = ϕ
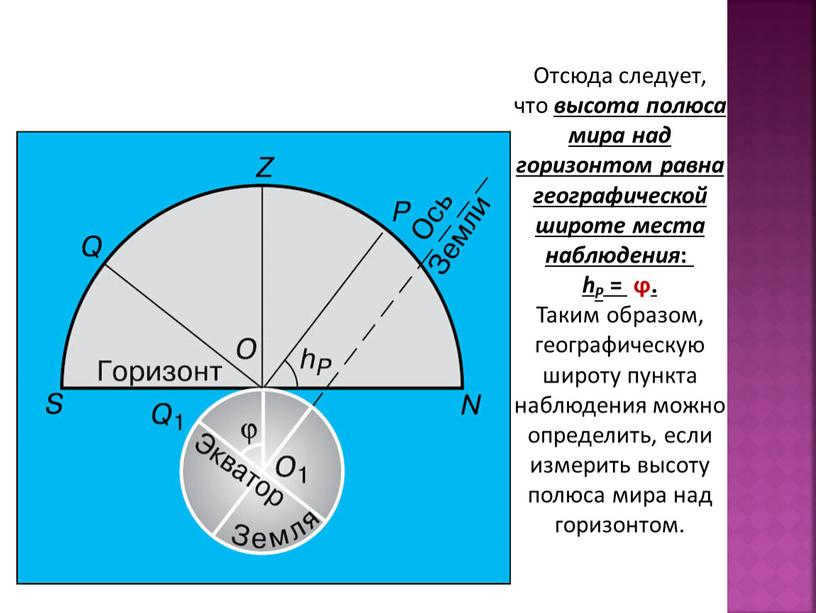
Therefore, it can be deduced that the elevation of the celestial pole above the horizon is equivalent to the geographical latitude of the observing location:
hP = ϕ.
Consequently, the geographical latitude of the observing site can be determined by measuring the height of the celestial pole above the horizon.

The starry sky and the way the stars move throughout the day varies depending on where the observer is located on Earth.
Studying the daily motion of stars at the pole
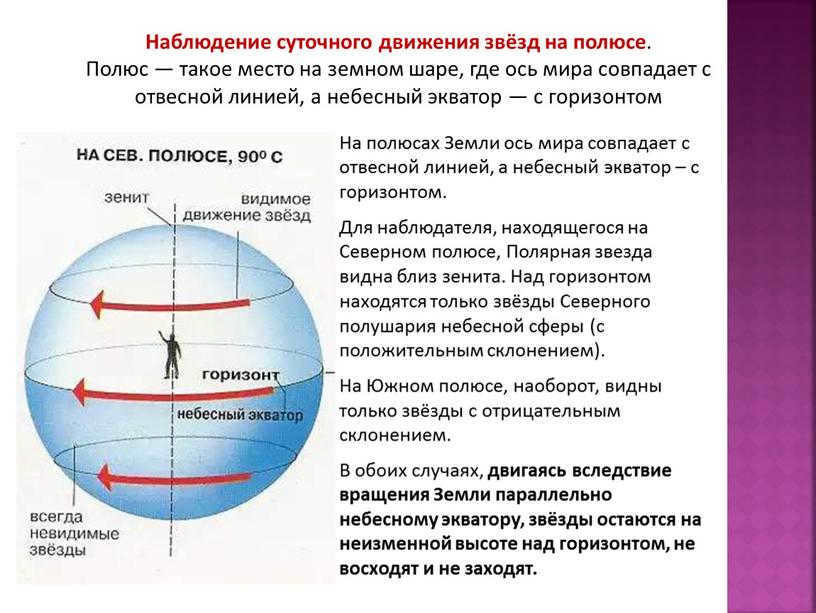
Observing the diurnal movement of stars at the pole.
A pole refers to a location on the Earth where the axis of the planet aligns with a plumb line and the celestial equator aligns with the horizon.
At the Earth’s poles, the planet’s axis aligns with a plumb line while the celestial equator aligns with the horizon.
For an observer at the North Pole, Polaris can be seen near the zenith. Only stars in the Northern Hemisphere (with positive declination) are visible above the horizon.
On the other hand, at the South Pole, only stars with negative declination can be seen.
When an observer moves due to the Earth’s rotation parallel to the celestial equator, the stars will stay at a consistent height above the horizon and will not appear to rise or set.
For the traveler, journeying from one location to another,
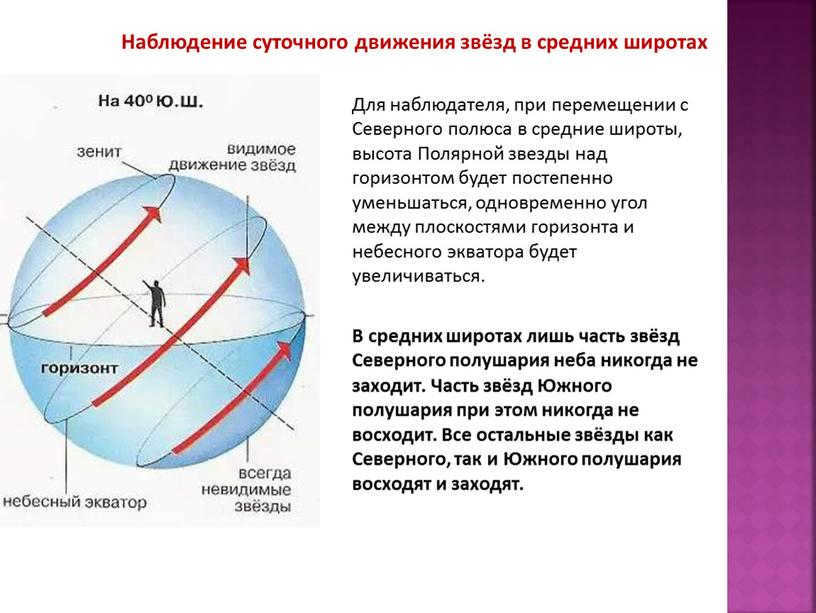
When an observer moves from the North Pole to the middle latitudes, they will notice that the height of Polaris above the horizon gradually decreases. At the same time, the angle between the planes of the horizon and the celestial equator increases.
In the middle latitudes, only a portion of the stars in the Northern Hemisphere of the sky never set. Meanwhile, a portion of the stars in the Southern Hemisphere never rise. However, all other stars in both the Northern and Southern hemispheres rise and set.
Observing the daily motion of stars in the middle latitudes
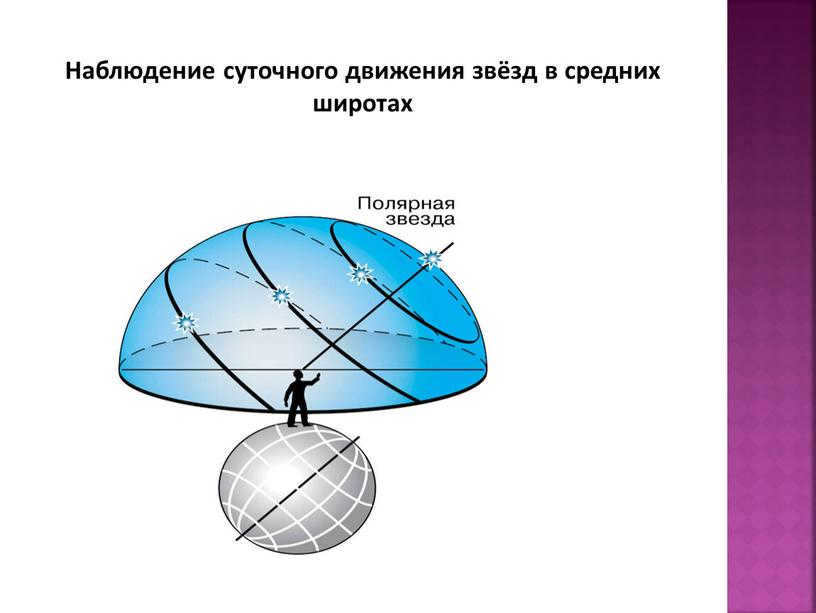
When observing stars at mid-latitudes, one can see that the world axis is positioned in the plane of the horizon. Additionally, it is worth noting that the celestial equator passes through the zenith.
The world axis is situated in the horizontal plane, while the celestial equator intersects the zenith.
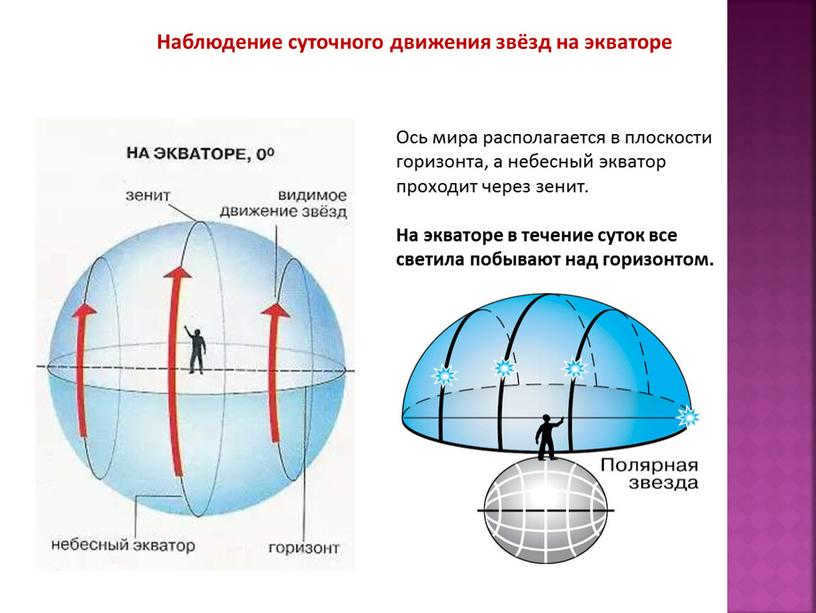
At the equator, all celestial bodies will remain above the horizon throughout the day.
Observing the daily movement of stars at the equator
The altitude of the celestial body at its highest point at δ
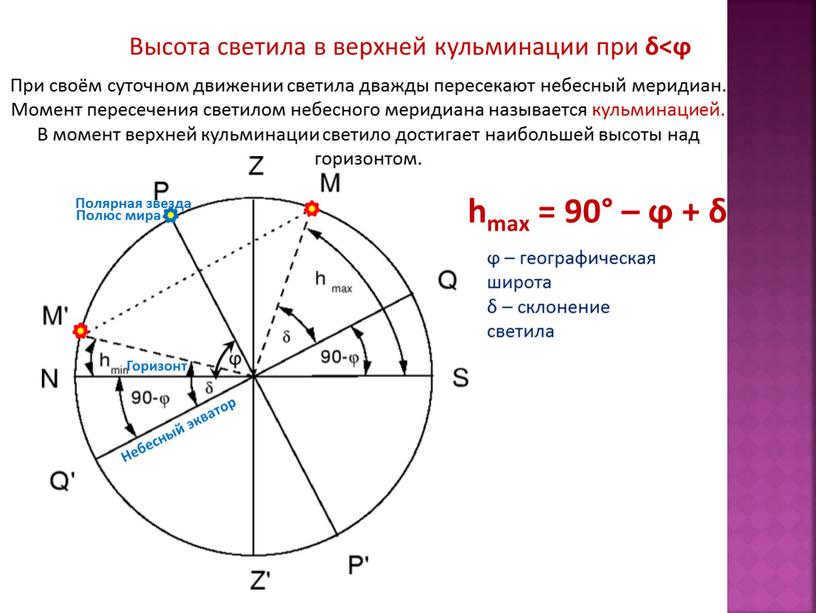
At the upper culmination, the luminary is at its highest point in the sky when its declination is δ δ.
ϕ represents the geographic latitude, while δ represents the declination of the luminary.
As the luminaries move throughout the day, they cross the celestial meridian twice. This crossing is known as the culmination.
During the upper culmination, the luminary reaches its greatest height above the horizon.
The luminary reaches its maximum height at the upper culmination when δ>ϕ. The maximum height (hmax) is equal to 90 degrees plus the difference between the observer’s latitude (ϕ) and the luminary’s declination (δ).
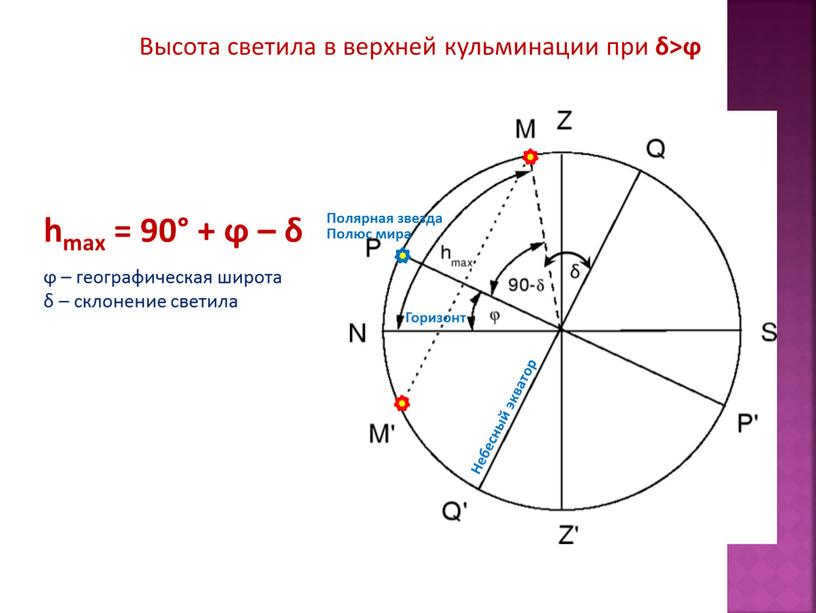
The height of the celestial body when it reaches its highest point in the sky at a latitude where δ is greater than ϕ.
ϕ represents the geographic latitude, while δ represents the declination of the celestial body.
Exercise 4 (p. 31) No. 1. Geographic Latitude
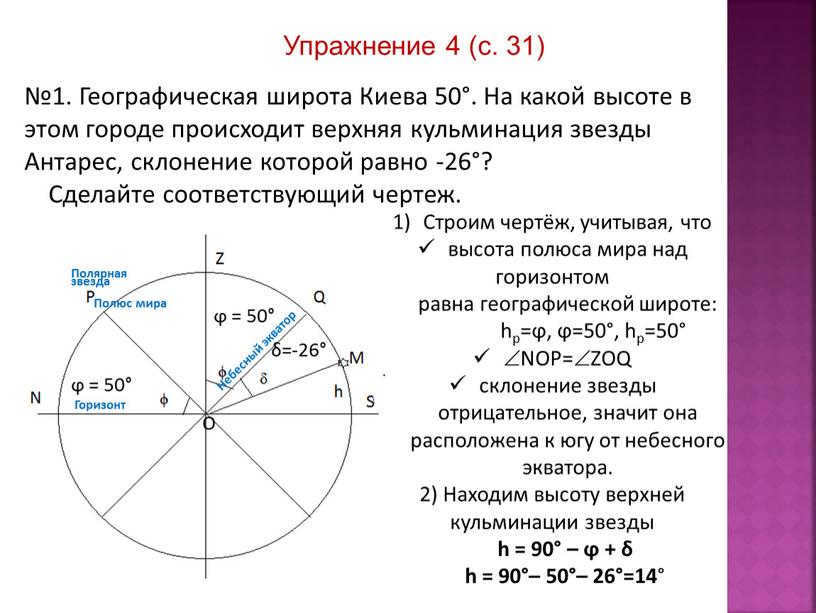
No. 1. Kiev has a geographic latitude of 50°. What is the altitude in this city where the star Antares reaches its highest point, given its declination is -26°?
Illustrate the corresponding diagram.
Create a diagram, considering that
the height of the celestial pole above the horizon
is equal to the geographic latitude:
hp=ϕ, ϕ=50°, hp=50°
NOP=ZOQ
the star’s declination is negative, indicating its position is south of the celestial equator.
2) Determine the altitude of the star’s upper culmination
h = 90° – ϕ + δ
h = 90° – 50° – 26° = 14°
Homework 1) Section 5. 2) Exercise 4: Number 2
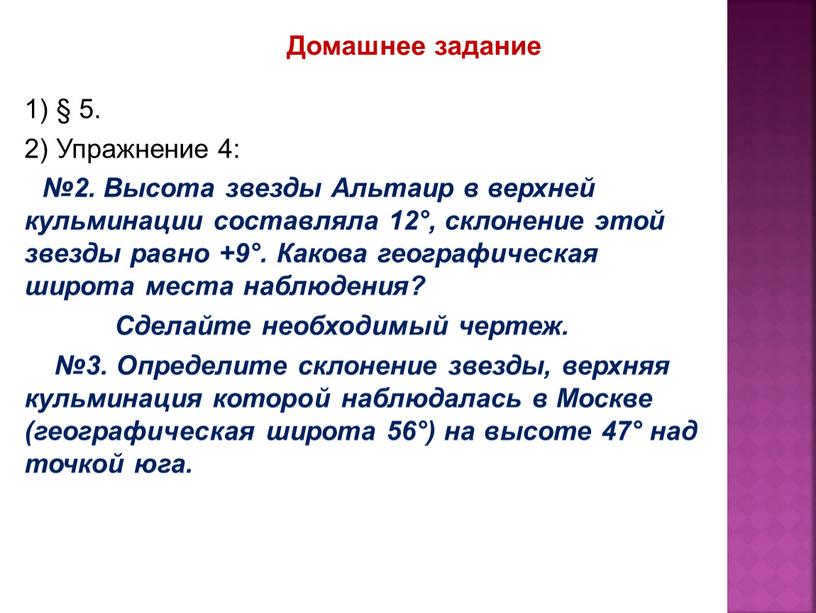
1) § 5.
2) Exercise 4:
No.2. Altair star’s altitude at the upper culmination was 12°, and its declination is +9°. What is the geographic latitude of the observation location?
Draw the necessary diagram.
No.3. Determine the declination of the star that was observed at its upper culmination in Moscow (geographic latitude 56°), with an altitude of 47° above a point south.
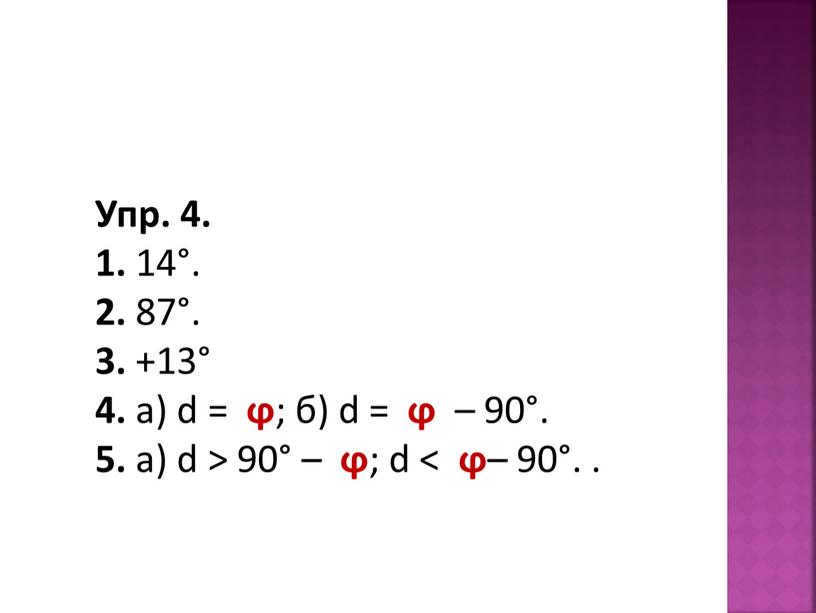
Task 4.
1. 14 degrees.
2. 87 degrees.
3. +13 degrees
4. (a) d = ϕ; b) d = ϕ – 90 degrees.
5. a) d > 90° – ϕ; d < ϕ– 90 degrees. .
The information on this page is sourced from public databases or provided by users in accordance with the terms and conditions of the website. If you believe there is a violation, please report it.

On January 3, 2010 at 8:53 am local time, the Sun was observed from Lamlash, Scotland (55° 31’47.43″ N 5° 5’59.77″ W / 55.5298417° N 5.0999361° W / 55.5298417; -5.0999361).
The position of the Sun in the sky is determined by both the time and the geographical location of the observer on the Earth’s surface. Throughout the year, as the Earth orbits around the Sun, the Sun appears to move in relation to the fixed stars on the celestial sphere along a circular path known as the ecliptic.
Due to the Earth’s rotation on its axis, the Sun also undergoes a diurnal motion, crossing the sky along the Sun’s path, which is influenced by the observer’s geographic latitude. The time at which the Sun crosses the observer’s meridian is determined by the geographic longitude.
To determine the Sun’s position at a specific time and location, you can follow these three steps:
- Calculate the Sun’s position in the ecliptic coordinate system.
- Convert the position to the equatorial coordinate system.
- Convert the position to a horizontal coordinate system based on the observer’s local time and location.
- 1. Approximate position
- 1.1 Ecliptic coordinates
- 1.2 Equatorial coordinates
- 1.3 Horizontal coordinates
- 1.4 Rectangular equatorial coordinates
- 1.5 Ecliptic tilt
- 2.1 Overview
- 2.2 Calculations
- 2.3 Atmospheric refraction
Approximate position
Ecliptic coordinates
These formulas from The Astronomical Almanac can be utilized to compute the apparent coordinates of the Sun, mean equinox, and ecliptic dates with an accuracy of around 0° 0.01 (36″) for dates ranging from 1950 to 2050.
To start, calculate n, the number of days (positive or negative, including fractional days) since noon GMT Earth time on January 1, 2000 (J2000.0). If the Julian date for the desired time is known, then the
The average longitude of the Sun, corrected for light aberration, is:
The average anomaly of the Sun (technically, the Earth in its orbit around the Sun, but it is convenient to imagine that the Sun revolves around the Earth):
Ensure that L and g are between 0° and 360° by adding or subtracting multiples of 360° as necessary.
λ = L + 1.915 ∘ sin g + 0.020 ∘ sin 2 g \ sin g + 0.020 ^ \ sin 2g>
Given that the ecliptic latitude of the Sun never goes beyond 0.00033 degrees,
, and the distance from the Sun to the Earth in astronomical units is:
Equatorial coordinates
. To obtain the right quadrant RA in computer programs, employ a double argument Arctan function like ATAN2 (y, x)
α = arctan 2 (cos ϵ sin λ, cos λ)
Rectangular equatorial coordinates
The rectangular equatorial coordinates are defined in a right-handed coordinate system. The X axis points towards the spring point, the Y axis is 90° to the east in the plane of the celestial equator, and the Z axis points towards the north celestial pole. These coordinates are measured in astronomical units.
Tilt of the ecliptic
When the tilt of the ecliptic is not available from other sources, it can be estimated:
To be used in conjunction with the equations mentioned above.
Declination of the Sun as observed from Earth
The trajectory of the Sun across the celestial sphere throughout the day for an observer at a latitude of 56° north. The trajectory of the Sun changes with its declination throughout the year. The points where the curves intersect with the horizontal axis indicate the azimuths in degrees from the north where the Sun rises and sets.
Summary
During the northern spring, the Sun appears to move towards the north and intersects the celestial equator at the March equinox. At the June solstice, the Sun’s declination reaches its maximum value, which is equal to the angle of inclination of the Earth’s axis (23.44°). Afterward, the declination gradually decreases and reaches its minimum value (-23.44°) at the December solstice, where it becomes the negative value of the axis inclination. This change in declination is responsible for the occurrence of seasons.
Plotting the Sun’s declination throughout the year results in a linear graph that resembles a sine wave with an amplitude of 23.44°. However, this wave has one lobe that is slightly longer than the others, extending for a few days.
If the Earth were a perfect sphere, in a circular orbit around the Sun, and if its axis were tilted 90 ° so that the axis itself were in the orbital plane (similar to Uranus), several interesting phenomena would occur. Once a year, on a specific day, the Sun would be directly overhead at the North Pole, resulting in a declination of +90°. Over the course of the following months, the Sun’s position would gradually shift towards the South Pole at a constant rate, crossing different circles of latitude at a consistent pace. As a result, the Sun’s declination would decrease in a linear fashion as time progresses. Eventually, the Sun would be directly above the South Pole, with a declination of -90°. At this point, it would start moving northwards at a constant rate. As a result, if we were to graph the solar declination from the perspective of this highly tilted Earth, it would resemble a triangular wave rather than a sine wave. It would zigzag between plus and minus 90°, with linear segments between the maximum and minimum points.
It is a known fact that the Earth’s path around the Sun is not a perfect circle, but rather an ellipse. This means that the Earth’s speed varies as it moves closer to the Sun (perihelion) in early January and farther away (aphelion) in early July. Consequently, changes in solar declination occur at a faster rate in January compared to July. This difference in speed is reflected in a graph, where the lowest points (minima) appear sharper than the highest points (maxima). Moreover, since perihelion and aphelion do not align precisely with the solstices, the highs and lows of the graph are slightly asymmetrical. The rates of change before and after these points are also not exactly the same.
As a result, the graph depicting the Sun’s apparent declination deviates from a perfect sine wave in multiple ways. This can be seen in the following example, where the precise calculation of the graph poses some challenges.
Calculation
The Sun’s declination, δ ☉, is determined by the angle between the Sun’s rays and the Earth’s equator plane…. The Earth’s axial tilt (also known as the ecliptic tilt) represents the angle between the Earth’s axis and a line that is perpendicular to the Earth’s orbit. The Earth’s axis tilt slowly changes over thousands of years, but its current value of ε = 23° 26′ remains relatively constant, resulting in a similar change in solar declination from year to year.
During the solstices, the angle between the Sun’s rays and the Earth’s equator plane reaches its maximum value of 23° 26′. As a result, δ ☉ = +23° 26′ on the day of the summer solstice in the northern hemisphere and δ ☉ = -23° 26′ on the day of the summer solstice in the southern hemisphere.
During each equinox, the Sun’s center appears to cross the celestial equator, resulting in a declination of δ ☉ of 0 degrees.
To calculate the Sun’s declination at any given time, you can use the following formula:
δ ⊙ = arcsin [sin (- 23.44 ∘) sin (EL)] = \ arcsin \ left [\ sin \ left (-23.44 ^ \ right) \ cdot \ sin \ left (EL \ right) \ right]>
EL represents the ecliptic longitude, which corresponds to the Earth’s position in its orbit. Due to the Earth’s nearly circular orbit, there is a small error of up to 1° when approximating it as a circle. This approximation leads to EL being 90° ahead of the solstices in Earth’s orbit, specifically on the days of the equinoxes. Thus, sin (EL) can be expressed as sin (90 + NDS) = cos (NDS), where NDS represents the number of days after the December solstice. Additionally, by approximating arcsin [sin (d) – cos (NDS)] as approximately equal to d – cos (NDS), the following commonly used formula is derived:
δ ⊙ = – 23.44° ⋅ cos [360° / 365 ⋅ (N + 10)] = – 23.44 ^ ^ \ cdot \ cos \ left [<\ frac <360 ^ > > > \ cdot \ left (N + 10 \ right) \ right]>
When N is the day of the year starting with N = 0 at midnight Universal Time (UT) on January 1st (part of the days of the ordinal date -1), the number 10 in (N + 10) represents the approximate number of days after the December solstice to January 1st. However, this equation tends to overestimate the declination near the September equinox to + 1.5°. It is important to note that the approximation of the sine function itself can lead to an error of up to 0.26° and is not recommended for solar applications. Another formula, Spencer’s 1971 formula, which is based on Fourier series, is also discouraged due to an error of up to 0.28°. It is worth mentioning that an additional error of up to 0.5° can occur in all equations for equinoxes if one does not use a decimal place when selecting N to correct the time after midnight UT for the start of that day. As a result, the above equation can have an error of up to 2.0°, which is approximately four times the angular width of the Sun, depending on its usage.
δ ⊙ = arcsin [sin (- 23.44 ∘) ⋅ cos (360 ∘ 365.24 (N + 10) + 360 ∘ π ⋅ 0.0167 sin (360 ∘ 365.24 (N – 2)))] = \ arcsin \ left [\ sin \ left (-23.44 ^ \ right) \ cdot \ cos \ left (<\ frac <360 ^ > > \ left (N + 10 \ right) + <\ frac <360 ^ > > > \ cdot 0.0167 \ sin \ left (<\ frac <360 ^ > > \ left (N-2 \ right) \ right) \ right) \ right ]>
which can be simplified by calculating the constants to:
δ ⊙ = – arcsin [0.39779 cos (0.98565 ∘ (N + 10) + 1.914 ∘ sin (0.98565 ∘ (N – 2))) ] = – \ arcsin \ left [0, 39779 \ cos \ left (0.98565 ^ \ left (N + 10 right) +1.914 ^ \ sin \ left (0.98565 ^ \ left (N-2 right) \ right) \ right) \ right) \ right]>
N represents the number of days since midnight UT on January 1st (i.e., the ordinal date -1) and can include decimal fractions to account for local time adjustments later or earlier in the day. The value 2 in (N-2) approximates the number of days after January 1st until Earth’s perihelion. The value 0.0167 represents the current eccentricity of Earth’s orbit. While eccentricity changes slowly over time, it can be considered constant for dates close to the present. The equation’s largest errors are less than ± 0.2°, but less than ± 0.03° for a specific year if the value 10 is adjusted up or down based on how far the previous year’s December solstice occurred before or after noon on December 22nd. These errors are compared to NOAA’s extended calculations, which are based on Jean Meeus’ 1999 algorithm and rounded to the nearest 0.01°.
(The formula mentioned above pertains to a relatively straightforward and precise computation of the Equation of Time, detailed in this article.)
More advanced algorithms account for variations in the ecliptic longitude by incorporating additional terms in addition to the first-order correction for eccentricity mentioned above. They also account for the slight variation in the Earth’s tilt of 23.44° as time progresses. These corrections also take into consideration the influence of the Moon on the offset of the Earth’s position from the center of its orbit around the Sun. After determining the declination relative to the Earth’s center, an additional parallax correction is applied, which relies on the observer’s distance from the Earth’s center. This correction is less than 0.0025 °. The error in calculating the position of the Sun’s center can be as low as 0.00015 °. To put this into perspective, the Sun’s width is approximately 0.5 °.
Atmospheric refraction
The calculations for declination mentioned earlier do not take into account the impact of light refraction in the atmosphere. This refraction causes the apparent elevation angle of the Sun to appear higher than the actual elevation angle, especially when the Sun is at a low elevation. For instance, when the Sun is at an elevation of 10°, it appears to be at an angle of 10.1°. By considering the Sun’s declination and its direct ascension, one can calculate both its azimuth and true elevation. These values can then be adjusted for refraction to determine the Sun’s apparent position.
The sundial will display time faster compared to an average clock showing local time when it is above the axis, and slower when it is below the axis.
In addition to the annual variation in the Sun’s position from north to south, there is also a smaller yet more intricate variation in the east-west direction. This variation is caused by the Earth’s tilted axis and the changes in its orbital speed due to the elliptical shape of its orbit. The primary effects of this east-west variation include shifts in the timing of sunrise and sunset as well as variations in the readings of sundials compared to clocks displaying local mean time. As depicted in the graph, sundials can be either ahead or behind clocks by approximately 16 minutes. This 16-minute difference corresponds to a shift of about four degrees east or west in the Sun’s apparent position compared to its average position. A westward shift indicates that the sundial is running fast.
The phenomenon primarily related to time is referred to as the equation of time, utilizing the term “equation” in its older sense denoting a “correction.” Variations are quantified in time units, specifically minutes and seconds, representing the extent to which the sundial deviates from the clock. The equation of time may either have a positive or negative value.
An analemma with the solar declination and equation of time on the same scale is a graphical representation that illustrates the annual variation in the Sun’s position on the celestial sphere relative to its average position as observed from a fixed location on Earth. The term analemma is occasionally used in other contexts, although infrequently. The analemma can be considered as a visual depiction of the Sun’s apparent movement throughout the year, which takes the form of a figure-eight shape. To create an analemma, photographs taken at the same time of day but on different days over the span of a year can be overlaid on top of each other.
The analemma can be visualized as a graph that represents the Sun’s declination, with the vertical axis, against the equation of time, with the horizontal axis. The scales are selected in a way that equal distances on the graph correspond to equal angles in both directions on the celestial sphere. For instance, 4 minutes (or more precisely 3 minutes and 56 seconds) in the equation of time is depicted by the same distance as 1° in declination, as the Earth rotates at an average rate of 1° every 4 minutes relative to the Sun.
The analemma is illustrated as if the observer were looking up into the sky, with north at the top and west on the right. This convention is typically followed even when the analemma is marked on a geographical globe where the continents are shown, with west on the left.
Several charts with analemmas are available, illustrating the Sun’s position on various dates throughout the year with a few days interval. These charts are useful for making analog calculations for determining sunrise and sunset times, as well as azimuths. Analemmas that do not have a specific date are often used to adjust the time indicated by sundials.